Month: July 2017

Good demand on larger offering

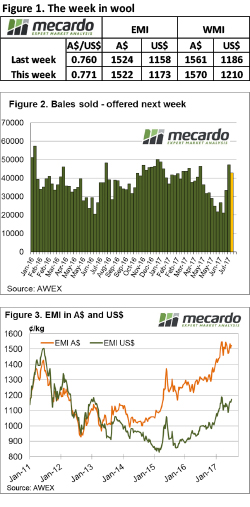
It seems wool growers are selling as soon as the wool is shorn, with another large offering coming forward. Despite this, the market performed well despite receiving no help from a rising A$. AWEX report that W.A.’s unseasonaly dry weather has seen growers bringing forward shearing causing the increase in supply this week.

The increase in the Fremantle offering resulted in 46,400 bales offered, with 42,900 sold and 7.7% passed in.

The market was strong, although the finer than 17.5 MPG and the 21 MPG and broader were the leaders. In other categories, crossbred types experienced good price rises of 10 to 20 cents, however the Cardings indicator fell in all centres by 10 to 25 cents.

While the EMI lost 2 cents in the auction, the stronger levels of A$ quoted yesterday at US$0.77 meant that the EMI actually rallied US$0.15.

The sale result this week is a perfect result leading into the recess. Buyers were able to secure plenty of wool and buyers paid higher US$ prices. This sets the scene for exporters to visit customers over the recess and secure orders for the resumption of sales in a climate of optimism; always a much better position that when sales end on a downturn prior to a break.

A note about the crossbred rally this week; while all types experienced price increases it was the better prepared lots that were most keenly sought out. It pays to now spend some time on preparing crossbred wool in the woolshed, as this will either improve the price compared to poorly prepared lots or at the least increase competition.

The week ahead

The market now enters a three-week recess, with sales resuming on the week beginning 7th August in Fremantle, Melbourne & Sydney.

Based on this weeks competition the market should open well in three weeks time, especially if the A$ can lose a little ground.

Newton’s Apple

In the late 1600’s Sir Isaac Newton, developed the theory of gravity. It seems that in addition to determining that apples will fall from trees, it seems that what goes up in the grain market also comes down. After a sustained rally over recent weeks, some of the gains have been lost, however there are still good opportunities.

The wheat market has had a stellar performance, with the SRW contracts rising an average of 87¢/bu since the start of last week (across the 6 nearby contracts). The market however lost around a 20¢ (figure 1) overnight. The market had become quite overbought in recent days, and it seems that speculators in the market have started to take some of their profits.

In figure 2, the three main US futures (spot) contracts are displayed. In this chart we can see that the rally for most of June was largely in MGEX spring wheat futures, before some flows into SRW. The reality is that the worst weather issues are currently around the high protein wheat (mgex), which globally is likely to be in demand, however we still sit on ample low protein wheat.

Although the market has fallen, it is still at an attractive level compared to the period since harvest. There are ample opportunities, for the grower looking further forward. As discussed in the analysis piece “Should we lock a far forward swap”, the high carry in the market place allows us to lock in close to a $300mt swap for 16 months time.

In reality, we do not know what will happen between now and then, there could be massive or miniscule harvests in 2018. However, starting the 2018/19 season at those levels traditionally would be attractive.

Next Week

The USDA will release their WASDE report in the middle of the week, which will likely see a reduction in crops in US, Australia and Western Europe. However, to what extent is the question, and what difference will that make to overall stocks.

The US crop condition will likely also show a reduction in crop condition, but with harvest in full swing it is likely with a negative result expected that this is priced in.

No rain, no grain no price gain for feeders

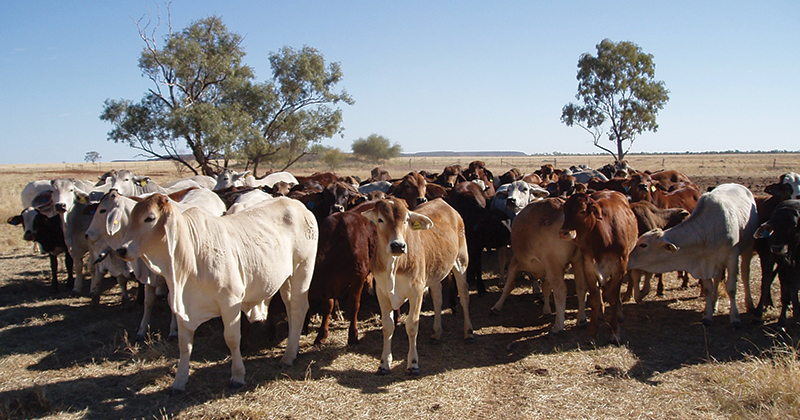
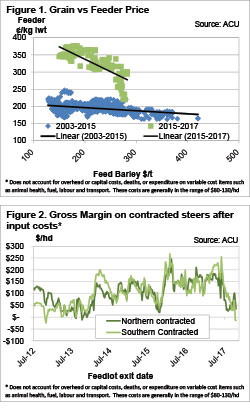
Grain prices have been on the rise. So what? A cattle producer might ask. How will it impact me? It depends what sort of cattle are being produced, but if it’s feeder cattle, rising grain prices are not good news.

Lotfeeders buy a large proportion of young cattle, and the other major input into a grainfed steer is obviously grain. The higher the grain price, the less money lotfeeders can pay for feeder cattle.

Figure 1 shows that feeder cattle prices have historically had a strong relationship with feed barley prices, but we can also see how this relationship has shifted since 2015. As grain prices rise, feeder cattle prices fall. The trendline on figure 1 shows that from 2003-2015, on average, a $50 rise in grain prices would equate to a 4.5¢/kg lwt fall in the feeder cattle price.

The trend became more pronounced at higher cattle prices after 2015. For the last 2.5 years a $50 rise in grain prices has, on average, equated to a 36¢/kg lwt fall in feeder cattle prices.

Over the last month east coast wheat prices have rallied significantly. New crop APW wheat has rallied $30 over the last month, while feed barley is up by a similar amount. Figure 1 shows there is actually a reasonably wide range of values of feeder prices at any given grain price, and this is due to other fundmentals.

Figure 2 shows how dire the move in grain prices might just be for lotfeeders. While many will have grain pre-purchased, those buying barley at current values, and paying 360¢/kg lwt for feeder cattle, are likely to be losing money.

Fortunately for feeder producers, young cattle supply is at its tightest level for the year over the coming two months. This may support feeder prices in the short term, but in the long term, higher feed prices are likely to start to bite young cattle values.

Key points:

  • Grain prices have a negative relationship with feeder cattle prices.
  • The strong rise in grain prices is likely to have pushed lotfeeder margins into the red.
  • Feeder cattle prices need to fall 30-40¢ to counteract the rise in grain prices.

What does this mean?

If grain prices and grainfed cattle prices remain around current levels, what price do lotfeeders need? On figure 2, lotfeeders need about $80-100/hd to break-even after overheads. The good news is it’s not a disaster. If feeder cattle prices fall to 330-340¢/kg lwt, it will be enough to see lotfeeders move back into the black.

On the upside, cattle producers growing heavy steers might actually find some support for finished cattle prices. Rising costs of production of grainfed beef generally tighten the supply of finished cattle, and push prices higher. Additionally, the decrease in the price of finished cattle, is unlikely to be reflected in the price of finished cattle, if it is due to grain price rises.

An Ovine slippery slide nearing the bottom

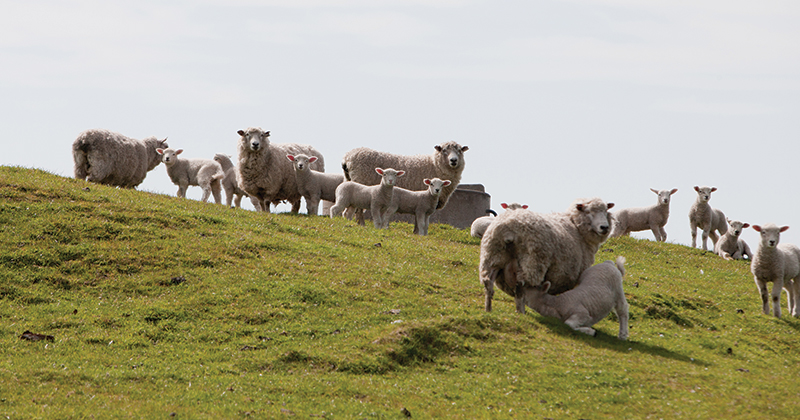
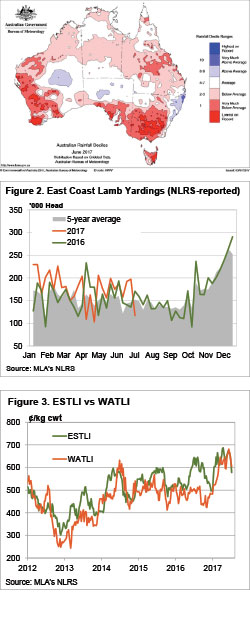
It doesn’t take a rocket analyst to work out why sheep and lamb prices have been sliding for the last month. The Eastern States Trade Lamb Indicator (ESTLI) this week broke through the 600¢ mark as the supply of stock direct to works appears to be reaching a peak.

Figure 1 is not a pretty sight for livestock or grain producers in the wheat-sheep belts of Australia. In particular the Riverina had its lowest rainfall June on record, and this is a time which is usually pretty reliable.

It wasn’t supply at the saleyards which saw the ESTLI and National Mutton Indicator (NMI) tank this week. Figure 2 shows that lamb supply at saleyards fell heavily, and the story was the same for sheep. Regardless the ESTLI lost 47¢ and Mutton 39¢ with the ESTLI at a 6 month low of 578¢/kg cwt, and the NMI a four month low.

The fall in saleyard supply back up the anecdotal evidence of processors being booked up with sheep and mutton flooding out of the NSW and Northern SA as the dry begins to bite, and prices remain historically ok. This is at a time when at least one major processor is shut for winter maintenance.

Interestingly in the West, where the dry has been pretty bad also, lamb prices have fallen but now sit at a premium to the ESTLI (figure 3) of 605¢/kg cwt. The WA Mutton market has been receiving support from the east coast, as it was trading at a large discount, but the now the east coast is now only around 40¢ better, which at $8 per head for a 20kg cwt sheep, is likely to stop the trucks heading across the Nullabor.\

The week ahead

Given the state of the flock, and the flock rebuilding intentions, it’s likely the rapid decline of the last month will come to a halt soon. Old season lamb supplies have to be close to exhausted, and new season stocks are a slow build from now on.

Expect sheep and lamb markets to find a floor soon, with further declines to come in late August and September if the season doesn’t turn around.

Heavy steers holding young cattle folding

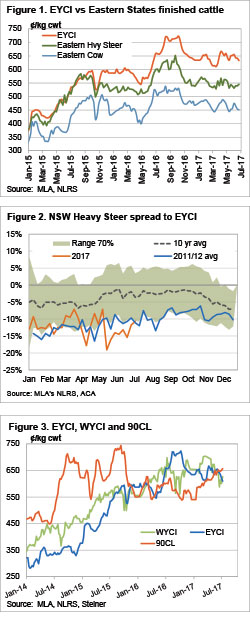
It was a better week for rainfall, with sporadic showers across the country, but it didn’t help the young cattle market. The Eastern Young Cattle Indicator (EYCI) continued its fall this week, but there was some support for slaughter cattle.

The EYCI fell a further 10¢ this week to hit a 12 week low of 610.75¢/kg cwt. This price is not far off a 12 month low, and now around 7% below the same time last year. A small rise in yardings was likely responsible for the fall in the EYCI, but there might be some waning restocker and feeder demand.

It doesn’t seem to be demand or supply of slaughter cattle which is sending the EYCI lower. Figure 1 shows that while the East Coast Heavy Steer price has reached the stratospheric level of last year, it hasn’t been falling in line with the EYCI lately.

Figure 2 shows that there is still some way to go for heavy steers to reach the ‘normal’ spread to the EYCI for this time of year. The NSW Heavy Steer has rallied from near a 20% discount to the EYCI to an 11% discount. The average for this time of year is 2%. If the spread returns to 2%, it will mean the EYCI has to fall to 560¢, or the Heavy steer will have to rise to 600¢.

Over in the West the slide in the Western Young Cattle Indicator has halted, and it even rallied a bit this week, finishing at 627¢/kg cwt.

The 90CL Frozen Cow Indicator was up 10¢ in a short week in the US to 656¢/kg swt. This is a 20 month high, and 9% stronger than this time last year. Processors are definitely doing a better job of keeping a lid on prices this winter.

The week ahead

Rainfall is forecast to again be sporadic, not really providing too much impetus for prices rises. The cold weather should start to bite on the finished cattle market, although with record cattle on feed, and rising grain prices we could see more cattle from that sector.

Young cattle supply doesn’t come from nowhere, and this is likely to support values in the short term. If the late winter and spring does fail however, the 550¢ mark is shaping as an initial target.

Wool gets by with a little help from a friend

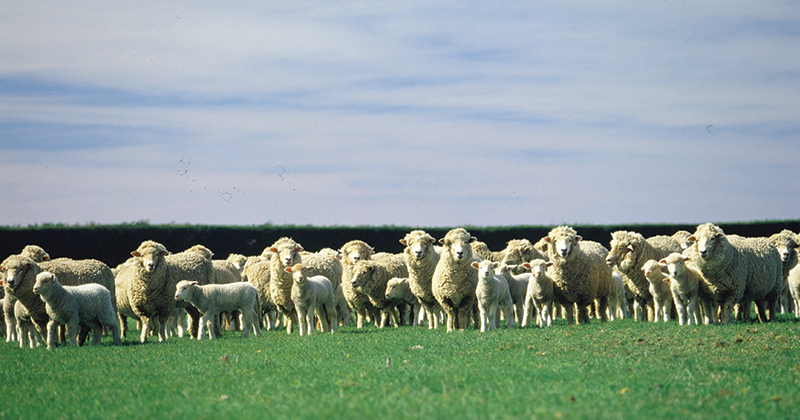
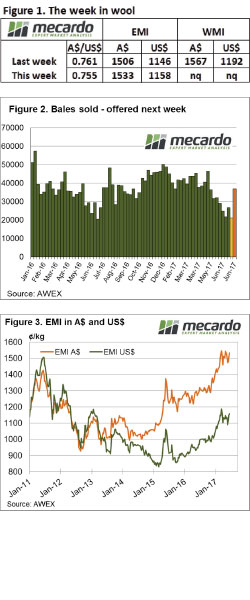
Again, the occasional, yet extreme demand for wool with good measurements (low mid breaks & good tensile strength) contributed to a mixed message out of this week’s wool market. The better types pushed the overall market to new levels while lower style wool battled to keep pace.

This week only Melbourne & Sydney were selling resulting in the smallest offering for the year at just over 22,000 bales. Buyers were active and purchased 21,104 bales although 5.4% was still passed in. The EMI improved A$0.27 for the week while the easing A$ resulted in a more modest US$0.12 lift.

Week–on–week comparisons showed that all categories (except 32 MPG) posted gains. However, in percentage terms it was again the medium Merino types that ended the week with the biggest lifts.

AWEX reported that the week just past was the lowest offering of Merino fleece types in over 8 years. This is reflecting the demise of Merino flocks over the recent time. As Mecardo has previously outlined, this is a concern for the long-term sustainability of the Australian wool industry as continued lower supply must translate into reduced processing capacity. Over time this will see wool continue to lose its position in the fibre market on volume. The challenge then will be to position wool as an even more niche product.

Impacting on the declining supply is the strong demand for sheepmeat resulting in lamb prices at record levels. As reported by Mecardo, with the big economies in Asia positioned to continue their appetite for Australian sheep & lamb encouraging sheep producers to continue their focus on meat this demand is likely to continue. Of course, a modern Merino flock is also taking good advantage of the high meat prices, so for those who have stayed the course with Merino sheep these are indeed good times.

The week ahead

Next week Fremantle returns to the selling roster and a larger offering of 37,000 bales is rostered – figure 2. It is with some confidence that wool growers should approach wool sales as a softening A$ and tight supply is encouraging wool processors to compete strongly.

A rocket to the moon, or even beyond the Kuiper belt?

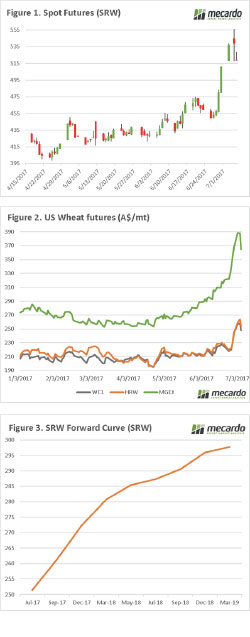
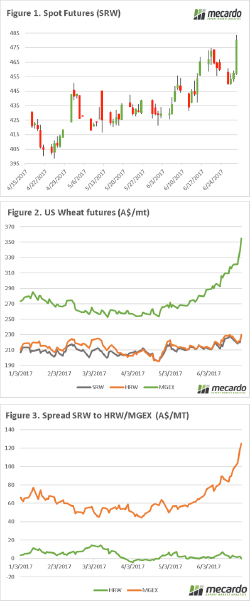
Well this is good news, wheat is on a journey to the moon, and at this rate beyond the planets. The downtrend of the past week has been reversed in dramatic fashion, is this a sign of things to come?

It’s the middle of the weather market, and as we have mentioned for months this is where opportunities can arise when the trade gets jittery. Overnight we saw futures close up across the board, with US futures up 5%, and Matif following up 2%.

The market has rallied on the back of continuing bullish data being release to the market, with the US drought monitor showing large parts of the Great Plains being in a rainfall deficit, and a corresponding drop in the crop potential. In Canada, canola planting according to Statscan have exceeded wheat, as a result of more attractive gross margins on the oilseed.

In figure 1, we can see the rise in nearby Chicago SRW futures, the rise was so high that I had to change my scale this morning to fit it on the chart. The spot contract has not been at this level since mid-June last year, before it fell as production became sure. As we go through the next month, how will the weather impact on the crop?

The rise in SRW has been fantastic, and most welcome to farmers around the world. However, it is dwarfed by the Minneapolis spring wheat contract which has been a stratospheric rise the like of which has been seen for a long time. In figure 2, we can see the SRW, HRW & Mgex contract converted into A$/mt since the start of the year.

The spread between SRW and HRW/MGEX is shown in figure 3, and it currently sits A$124 above spot SRW. This is due to the expected shortage of hi-pro wheat, will this rise be sustainable and make it past the moon, and beyond the Kuiper belt or will it crash back down to earth?

Next Week

The USDA will release their quarterly grain stock reports, will this show a downturn in US stocks or has less been used than expected. This report has traditionally had the capacity to move the markets markedly.

All strategies must evolve to take into account the potential average-low production environment in the coming season. There is no point removing price risk in order to replace it with production risk.

Live export market share and price relationships

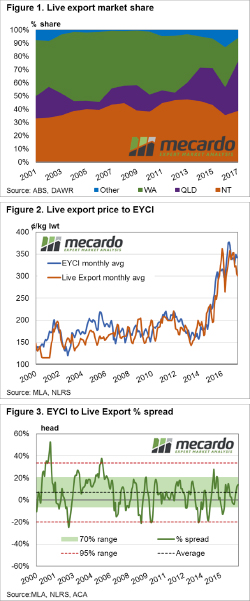
It has been some time since we had a look at live cattle exports so we thought it timely to focus in on the changing market share of the live cattle trade among the key export states, along with the price relationships that exist between live cattle and domestic young cattle.

Figure 1 outlines the percentage of market share in volume terms that are attributed to the three largest exporting states for live cattle, namely the Northern Territory (NT), Queensland and WA. Historically, NT and WA have held the lion’s share of the trade volumes over the last two decades. NT market share has been relatively stable fluctuating between the seasons from 35-45% of the total trade volume. In the last five years there has been a noticeable expansion of volume exiting Queensland. Indeed, for much of the period from 2001 to 2013 Queensland accounted for 10-20% of the trade. However, in recent times the proportion of live cattle leaving Queensland has extended toward the 25-30% range.

Turning our attention to price movements we can see a fairly strong relationship between average monthly EYCI prices when compared to a Live Export Index (created by averaging the live weight prices per month out of the ports of Broome, Townsville and Darwin). Analysis of the correlation between the monthly EYCI and the Live Export Index shows a correlation co-efficient of 0.83, which is indicative of a reasonably strong relationship between the two-price series. The correlation in price movement increases to 0.94 when the two-price series are compared on an annual average basis.

Analysis of the historic monthly percentage spread between the EYCI and the Live Export Index shows the EYCI to Live Export long term average spread sits at a premium of 7% and spends 70% of the time fluctuating between a 6.5% discount spread to a 20% premium spread (green shaded zone – figure 3). The red dotted lines highlight the 95% range between a 20% discount spread to a 33.5% premium spread, indicative of the extreme ends of the historic range.

What does this mean?

Analysis of seasonal live cattle trade flows shows that volumes out of Queensland tend to peak in the first quarter of the year, while WA peaks mid-year and NT peaks at the end of the season. This would suggest that the current market share of volumes out of Queensland at 28% is likely to diminish slightly as the year progresses and volumes out of WA and NT expand.

The current percentage spread of EYCI to Live Export prices sits at a 14% premium, and within the 70% range banding, which indicates that price levels for the two data series are comfortably within the “normal” range and suggests that neither price is too far over or undervalued in comparison to the other.

Key points:

  • Live cattle volumes exiting Queensland has shown steady growth in percentage market share in the last five years.
  • Movements of the EYCI and Live Export cattle prices show a close relationship over both monthly and annual average comparisons.
  • The EYCI tends to sit at an average premium spread to Live cattle prices at around 7%, but can fluctuate between a 20% discount to a 33.5% premium, dependent upon the season.

Soft prices a tale of the weather and supply

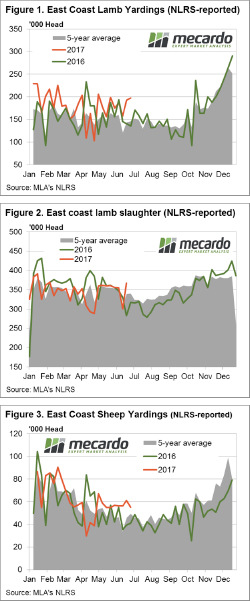
On the radio in today the weather report included a brief from BOM saying that June has been the driest in Victoria since records began and its taking its toll on the price of lamb and sheep. East coast figures show price falls in all categories other than Restocker lambs on the week and Light, Heavy and Trade lambs are now trading lower than this time last year.

The Eastern States Trade Lamb Indicator dropped 3.8% this week to close at 625¢/kg cwt and National Mutton shaved off 5.7% to see it at 467¢/kg cwt. East coast supply metrics providing a clue to the weaker prices with lamb and sheep throughput and slaughter tracking well above last season and the longer-term average levels for this time in the year. Drilling into the figures on a state by state basis shows that NSW is leading the pack in bringing forward supply.

East coast lamb throughput up 2.5% on the week to over 197,000 head, and while the weekly change isn’t too earth shattering a look at the trend compared to this year and the five-year average shows it to be 35% higher than it normally is this time of year – figure 1. NSW lamb yardings are currently sitting 50% above the five-year average, with over 138,000 head going to the saleyards this week, clearly having an impact on the East coast figures.

A similar pattern displayed in lamb slaughter for the week ending 23rd June with a jump in head of 22% to just over 367,000 this week – figure 2. NSW, again the key state behind the surge with a 26% lift in lamb slaughter on the period. East coast mutton yardings levels dipped on the week, but remain persistently high when compared to this time last season and against the five-year average, figure 3.

The week ahead

A look at the rainfall forecast for the next week doesn’t hold much promise for a surge in prices with the best falls noted out at sea across the Great Australian Bight, Bass Straight and the Tasman Sea. The Tasmanian West and North-west will get some reasonable levels and parts of the WA, SA and Victorian coastline look promising, but for much of the sheep rearing regions it is going to be pretty light on. Happy end of financial year.

It’s a rare thing for cattle prices to fall in June

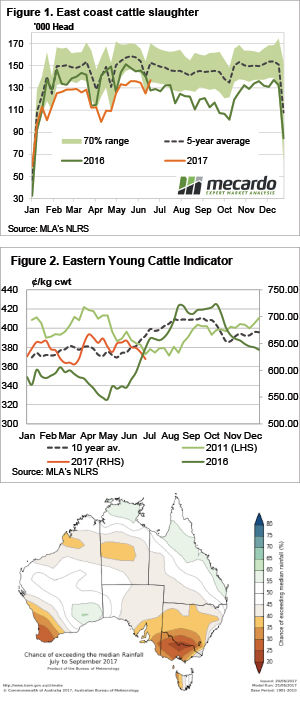
Here’s a quiz question. When was the last time the Eastern Young Cattle Indicator (EYCI) finished June lower than it started? You’ll have to read the article to find out….

Young cattle markets continued to slide this week, the EYCI dropped another 12¢ to finish the week, and the month at 621¢/kg cwt. Dry weather and historically high prices appear to be driving cattle to market as a time when supply is usually tightening.

Nothing exceptional is happening with cattle yardings, they were down a touch this week, and largely in line with the same week of the last two years. Cattle slaughter is doing strange things however. In the week ending last Friday, east coast cattle slaughter reached a peak for 2017, setting a 7 month high.

Figure 1 shows MLA’s weekly cattle slaughter figures hitting 137,019 head, 7% higher than the same week last year. It was also the first time weekly slaughter had been higher than the previous year since this exact week back in 2015.

If something sounds familiar, but backwards, it’s because we have been banging on in recent weeks about prices falling below the same time last year for the first time. It was the EYCI’s turn this week (figure 2), posting a lower price than the same week in the previous year for the first time since March 2014.

It’s always a nice fit to see stronger supply than last year equating to weaker prices. It tells us demand is relatively steady, with price being governed by supply.

The week ahead

The answer to the question is given away in figure 2. In 2011 the EYCI finished June lower than it started, by 24¢. This year it was 34¢. It also happened in 2003, so that’s 3 out of 18 years cattle prices have fallen in June. It’s not a regular occurrence. The good news for cattle producers is that in 2011 prices levelled out, but figure 3 shows this might just be the start of the slide.