Category: Grain

We’re not in Kansas anymore.

Wheat is not just wheat. There are multiple varieties bred for different purposes from durum to noodle wheat. There are also multiple futures contracts which can be used based on quality and geography. In this article we will be looking at Kansas and Chicago futures.

In order to start, its worth defining the two contracts. The Kansas contract or hard red winter wheat (HRW).  The HRW wheat crop is grown in Texas, Nebraska, and Kansas. The HRW is mid protein (min 11%) and is therefore perfect for producing bread. As a winter wheat, it is planted straight after harvest (August/September) with harvest occurring during the following summer (late May/August).

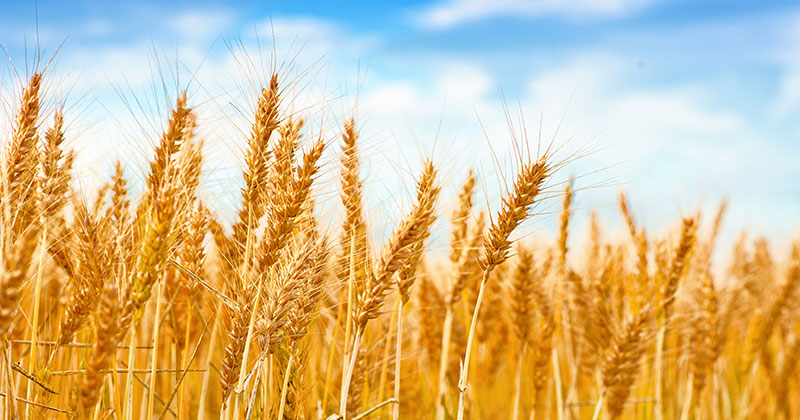
In Australia most commentators refer to the Chicago contract, as it is the most heavily traded wheat contract in the world. Chicago contract is soft red winter wheat (SRW). The SRW contract is low protein, with a typical profile of 9.5%. This crop has a similar planting and harvest window to HRW and is used for pasta, animal feed and biscuits.

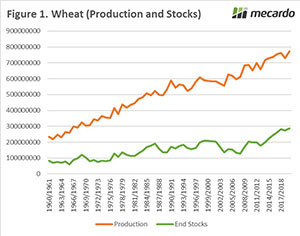
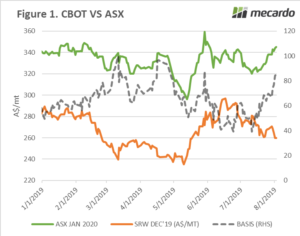
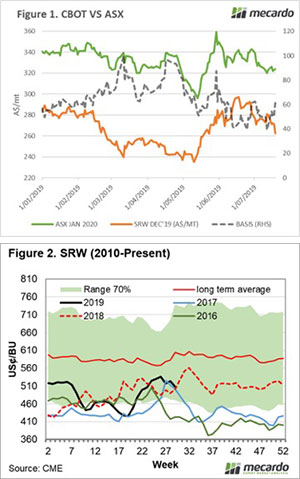
In recent years the basis between Chicago and Kansas has shown a 28¢/bu discount for Chicago wheat futures. This makes sense as Kansas wheat is a higher quality product, however in the past year we have seen Kansas futures moving to a strong discount to Chicago. This discount is currently 70¢/bu (figure 1).

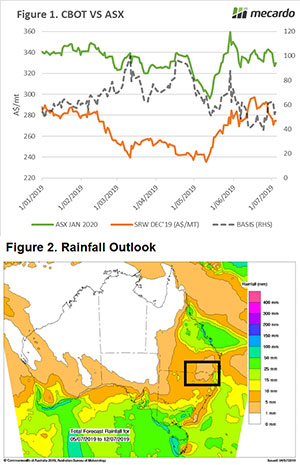
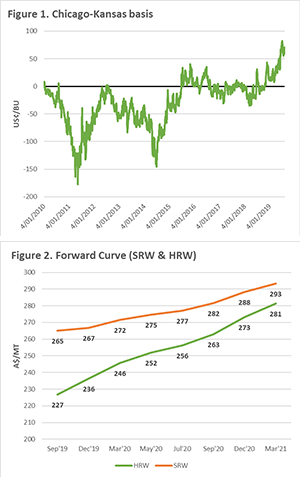
In figure 2, the forward curve is shown for both contracts (in A$/mt). It is always important to examine the curve as it can provide a strong insight into hedging opportunities. As we can see the Kansas contract is at a strong discount to Chicago at present, however it does start to converge further down the horizon.

The question at present is whether the Chicago futures will decline to meet Kansas or whether Kansas will rise to meet Chicago.

What does it mean/next week?:

At present the separate US futures contracts both provide differing opportunities for both growers and buyers.

Grain growers: The Chicago contract offers a price of A$288 for December 2020 (harvest). As an Australian producer we would then include basis – which typically would be positive. However, the ASX Jan 2021 may offer better value than using overseas futures at present.

Grain buyers: There is an opportunity to buy Kansas for September at A$263. This would give protection from rallies in the US market through next year’s volatile period. Through buying the September contract, it would provide ample opportunity to lock in basis prior to harvest or use any hedge revenue against the prior year’s requirements.

A new month.

With a new month comes new opportunities. This week we take a look at the futures market and basis levels around Australia.

Let’s start with the global picture. The market has largely traded in a sideways motion since the end of July, with December Chicago futures up 1¢/bu. However, the falling A$ has led to an increase of A$3.

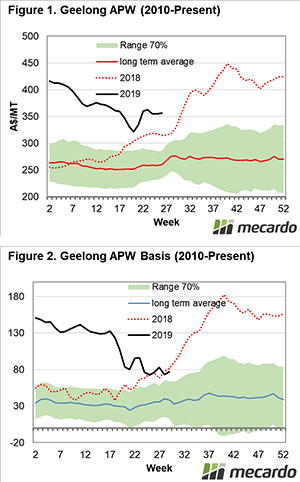
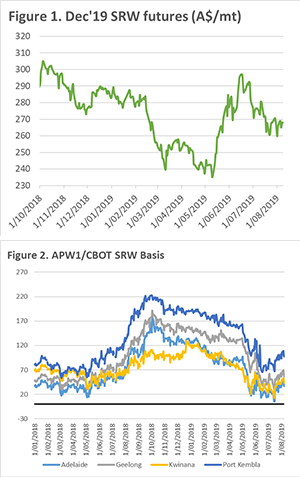
As we can see in figure 1, the gains of June have now largely dissipated with pricing levels back to mid-May levels and A$29 lower than the peak. The higher than expected yields in Europe are leading to a bearish undertone, nonetheless, the trade will be examining the forthcoming WASDE for some direction.

Although international markets are typically our biggest driver of prices in Australia, memories of the recent 12 months tell us that we can go it alone. The basis levels during last season were record high, but what about this coming harvest?

At present, the basis levels for the major Australian ports have declined and are now back to the same levels as this time last year. These levels are obviously high in areas of deficit (east coast), however far from the peaks.

The basis levels for new crop have been improving in recent weeks, although the recent rains in Victoria and South Australia will likely temper some of the gains. There is a lot of water to go under the bridge between now and harvest – so a nervous environment is likely to persist.

Remember to listen to our podcast

Next week?:

The WASDE report will be released next week which will provide some clarity on supply of both wheat and corn. The question of the validity of USDA forecasts always remain but it’s still a market driver.

The recent rains in Victoria and South Australia will provide some confidence to producers, but will it push buyers away from the market?

The turning point in pricing?

The end of July sees Australia and the US once again starting to diverge away from one another, with drought concerns coming to the fore. In this week’s comment, we briefly discuss the direction of the market and the recent external administration of another grain trading company.

The start of a new month has seen Chicago wheat futures decline with A$9 lost in the past two days. Harvest pressure and good conditions in Ukraine have led to the fall, the result being futures falling in Aud terms to the lowest level since May.

At a local level, the ASX has put on a spirited drive with futures rising in recent weeks from lows during the last month of A$320 back up to A$345. The decline in CBOT and rise in ASX sees basis between the two at $80, a value above the average and moving into drought territory.

During this week I drove from Ballarat to Speed in Victoria. The crop is in good condition with plenty of potential. The same story, however, cannot be said for NSW, which now can, unfortunately, be largely written off.

Although Victoria and parts of South Australia are presently in good condition, there is still a long way to go. If we see major falls in production, we will likely see very strong appreciation of prices in a similar matter to last year.

A lot of the talk around the industry has been around Grainpro. After much rumour and speculation, Grainpro has gone into external administration. The purpose of the external administration is generally to give a company time to avoid insolvency. From experience, they rarely continue for much longer after going into external administration.

I have spoken to a number of growers who are owed substantial amounts of money and hopefully they will be able to recoup some of the losses. However past experience of grain insolvencies has seen little in the way of cash trickling down to growers.

Listen to our podcast on ‘Insolvency in the grain game’ or this article ‘Grain trade insolvency – a real danger?

Next week

The next week will bring the August WASDE report, which will be interesting as the market attempts to digest how dry conditions in Russia are impacting upon the global supply and demand estimates.

The rainfall forecasts look quite light which are concerning as we move through the important august growing period. Fingers crossed that some falls eventuate.

Seasonality in your area #1 – Geelong

You should have started your grain marketing program by now, but if you haven’t it’s time to start keeping an eye on the market. In this series of articles, we will examine the seasonality in pricing for wheat across the country. This week we will start off in Geelong.

Seasonality can provide an indication of the performance of a commodity, in a similar way to deciles. We regularly use them to show how the market is travelling at present compared to previous points in time and view patterns that might emerge.

In these seasonality charts, rather than use a min/max for the seasonality banding (green shaded area), we use a 70% range (or 1 standard deviation). The 70% banding is used to remove the extremes in the marketplace, which we believe gives a better indication of the seasonality, as opposed to a min/max which can be extremely volatile. In these charts, we also overlay the average for the timeframe and the recent seasons.

In figure 1, the flat price for APW wheat in Geelong is displayed. The flat price is the price that you will receive from a buyer (the combined futures, basis and FX). During the past year we have experienced extremely high prices. Even now with prices falling close to A$100 since the peak, they still represent strong levels.

In figure 2, the basis level between Chicago and Geelong is displayed. In order to get the best return for your production it is important to understand basis (explanation here). The extreme basis was the reason behind the high prices during the past season. The drought has caused premiums above Chicago to increase due to the scarcity of supply locally.

In both flat price and basis we can see that for the first six months or so they trade in a relatively narrow band. The last half of the year is where any action will arrive, this is where the price will either rise or fall dependent upon how the season progresses – more grain lower basis (and vice versa).

Key Points

  • The Geelong market has fallen close to A$100 from this seasons’ peak, however remains at prices which would be historically attractive.
  • The first half of the year tends to trade in a narrow range, followed by a bigger spread in the second half of the year.
  • Prices are liable to be volatile as we move close to harvest so we may see some downside.

What does it mean/next week?:

The spot price has declined markedly but due to the rainfall and moisture profile this year, this signals good prospects for the upcoming harvest in regards to production. We are now at the midpoint where the pricing will reflect the supply of Australian wheat. However, until harvest, spot prices are likely to be extremely volatile as pantries remain empty.

Record breaking heat in Europe

In this week’s comment we take a look at local pricing and the current environment in Europe. Will the weather help or hinder the crop?

The futures market has largely been bereft of data to drive it during the past week and has largely traded in a narrow band. December Chicago futures are down A$3 since last Friday and A$28 from recent peaks.

On a global level the International Grain Council have revised their forecasts for the coming season. Global production is down month on month by 6mmt, with consumption also being revised downward by 3mmt. Overall stocks were brought down to 270mmt, which remains joint record with 2017/18.

At a local level, old crop pricing has come under some pressure (figure 1). As we move closer to harvest, I can foresee two potential scenarios:

  1. The price declines will continue until the new crop harvest or until they converge with new crop pricing.
  2. If there are any delays to harvest, old crop will rally as hand to mouth consumers chase what little is left.

Europe has experienced some extremely hot weather with records being broken across the continent. The wheat/barley crop is unlikely to be massively impacted as they are harvesting, however corn remains the biggest risk. The hot weather could ultimately lead to downgrades to yield. In a similar fashion to the US corn/wheat story there could be a flow on effect on wheat pricing.

Remember to listen to our podcast 

What does it mean/next week:

Analysts are currently looking at the Russian wheat crop, with the consensus being that a good crop will be produced but not a record worthy one. Interestingly it is looking like Ukraine are on track to produce a record crop.

Rollercoasters also go down.

In the past week A$18 has been lost from the December CBOT wheat futures, back to mid-May levels.

Figure 1 outlines the movements of the wheat market since the start of the season. The reasons for the recent falls are as follows:

  • Harvest has commenced in parts of the US. This has prompted a fast pace of selling by producers, and the extra supplies has pushed down the bids offered by buyers. This is a similar pattern that we see in Australia during harvest.
  • Many parts of the US still in the growing phase are set to receive beneficial weather over the coming weeks.
  • US export sales remain poor as other origins come on stream. This has pressured the US market to fall in order to remain competitive.

In recent weeks the ASX market has fallen, and it would be expected that the large fall overnight will see pressure on local bids. At present ASX-CBOT basis for the harvest period is at the highest level since the start of July (+A$60).

This period of the year is always one of great volatility, with this year being no exception. In recent years there has been a rally during midyear followed closely by a crash (Figure 2). This year has probably been the most bullish environment, however the question remains whether there will be a rebound after recent falls or whether the pattern of recent years will continue.

In other news, rumours abound of very slow payments being made by a grain trader. At present these are just rumours, so no names cannot be given due to the potential legal ramifications. However, I advise that you read this article I produced around the time of the Lempriere Grain collapse.

As an extra piece of advice. Do not accept any excuses/promises if you are well overdue on receiving payment.

What does it mean/next week?:
The trade is still waiting for fresh data to determine what the corn acreage is likely to be. I have a feeling that most will have made their assumptions and when the data comes out the speculators will likely provide a short boost, but it may be short lived.

There are decent weather forecasts for the southern growing region over the next fortnight. As seems to be the case the norther regions in NSW & QLD seem to be missing out again.

The market skew

In this analysis we look at the overall Chicago wheat each year since 1973 to examine the skewness of the market. This provides an indication of how far the market trades from the normal distribution and provide some insight into where prices have historically been.

In this article, we are going to look at the ‘skewness’ of the wheat market over an extended period of time.  To start with, it is important to define what we mean by skewness. Many of you will be aware of the normal distribution or bell curve (Figure 1). The bell curve describes a symmetrical data distribution where the results will be 50% below or above the peak, with most (or 68%) being close to the mean.

The skewness of a distribution curve represents the degree of distortion (or lean) from the normal distribution. The bell curve example (Figure 1) represents a dataset with no skew. The lean can be either positive or negative, depending upon whether the tail of the data is to the left or right.

There are some examples of skewness based on individual years in Figure 2 (animated). In 1984, the pricing of wheat followed very closely to a normal distribution, with most daily prices within 1 standard deviation of the mean. In 1976, there was a strong negative distribution with prices heavily skewed above the mean and in 2017 the lean was positive with prices skewed lower.

In Figure 3, I have calculated the annual skewness on the daily spot price for Chicago wheat futures from 1973 to present. Prices have overwhelmingly been skewed towards the positive. There have only been eleven years when the skew has been negative and seven of those years have been prior to 1990. This means that in most years since 1973, the daily price has been skewed lower.

What does it mean/next week?:

On an annual basis, the Chicago wheat contract has spent most years with a positive skew. This means that prices have trended lower than the mean.

This could point towards the importance of growers hedging when prices are strong. As the market tends to trade with positive skewness, we would expect prices to trend lower than the mean.

Key Points

  • Skewness represents the ‘lean’ from the normal distribution.
  • Positive skewness in wheat pricing shows that the distribution leans to the lower side of the normal distribution, and vice versa for negative skewness.
  • There have only been eleven negative price skews since 1973 (including the current year).

Is the market right for a forward contract?

It is important to keep an eye on the market for pricing opportunities, especially beyond the current season.

In the past few years, there have been excellent opportunities at this point of the year to lock in strong futures levels, especially offshore. How does it stack up for producers at the moment?

Firstly, let’s look at CBOT wheat. After a strong rally the market has stalled whilst awaiting new data. At present that market is not yet at the highs of last year, but with corn acreage likely to be radically altered in the coming weeks. This makes an opportune time to start putting together a strategy for pricing.

At present the Chicago wheat market is in contango (Figure 1), which means that forward months of the market are at a premium to the spot (present) market. The December wheat contract is currently trading at A$273/mt. Taking out a futures contract (or swap) at this level will protect you from any downside in the futures market, whilst still retaining any exposure to basis. We expect that basis will remain quite strong this year in many parts of the country due to an average crop coming off the back of a poor crop.

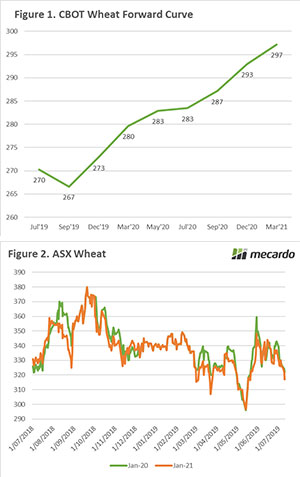
However, when we look further out to next December (2020), we can see that the futures contract is trading at A$293/mt. This may be a more attractive proposition when using CBOT futures as it provides a level which will most likely end with an overall price well above A$300/mt when basis is added.

CBOT is a good tool for using, but there are also the ASX futures, which have been gaining more volume in recent times – as drought has bit. The ASX contract has fallen in recent weeks as local conditions improve and consumers step back from the market.

The contracts for both Jan 2020 and Jan 2021 (figure 2) are both trading at similar levels of A$322 and A$317 respectively. A far cry from last September when our advice was to lock in contracts at A$370-380. However, this does still provide levels which are reasonably attractive.

What does it mean/next week?:

Price risk management is not about hitting the top of the market, it is about locking in a level or protecting yourself from adverse movements.

I tend to advocate a small bite size approach, where you take small positions in the market when it is attractive. This will protect you from downside whilst still providing some opportunity to participate in any upside.

Key Points

  • Chicago wheat futures are offering A$273 for this December and A$293 for the following.
  • ASX wheat futures are offering A$322 for this January and A$317 for the following.

WASDE, Burgundy & Dry outlook

The bulk of the world’s wheat crop is produced in the northern hemisphere, if something goes wrong there it can have a colossal impact upon pricing. Overnight the USDA released their July WASDE report. In this week’s comment, we will look at who the winners and losers were.

The overall picture for wheat is shown in figure 1. In the coming season production and stocks are expected to be at record highs. World production is however down 9.3mmt, and big chunks of the reduction are coming from export states.

  • Australia -1.5mmt
  • EU -2.5mmt
  • Russia -3.8mmt
  • Ukraine -1mmt
  • Canada -1.2mmt

This has resulted in the futures market posting solid gains overnight (A$7.80), which will likely flow through to local prices today.

In producing the WASDE report, the USDA have continued to use the acreage figures from the heavily disputed June acreage report (see here). As they will be resurveying the US producers over the coming month, it largely means that corn supply figures will be extremely dubious until the next USDA update. Although most traders and analysts will be making their own assumptions on the acreage planted to corn, there is still likely to be fireworks when more legitimate data is released.

Although anecdotal we received some promising crop news from our current EU correspondent. David Skipper, one of our trusted contacts and general manager of Tap Agri Co (Tasmanian Grain Handler) has sent us some reports back from his trip to France with the following comments:

I can confirm that the wheat, barley and canola crops are huge and in magnificent condition. The French (in the burgundy region) are now harvesting and crops are thick and heavy. I saw one wheat crop that had fallen over in some parts of the paddock.  I don’t think the French need to worry about crop yields this year. (Pictures)

The Bureau of Meteorology released their three-month outlook yesterday. It was quite bleak with drier than average conditions expected across much of the wheat belt. Long range weather forecasts at times have to be taken with a pinch of salt, however it remains concerning.

What does it mean/next week?:
The market in Australia is likely to see a rebound as it digests both the rise in overseas futures and the prospect of dry weather over the next three months.

What does the wheat market and ice-hockey hacks have in common?

The wheat market has well and truly entered the volatile northern hemisphere weather market. It looked for a while like the wheat market was only moving in one direction. However, the past week has seen a retreat in pricing.

The wheat market and I have something in common. We both hit a wall and have broken down. My wall was whilst playing ice hockey (broken arm), the market’s wall was improving conditions. Since last Thursday, December CBOT wheat futures have declined A$17/mt, with ASX following the overseas market down (Figure 1). However, basis has somewhat strengthened (A$5), although this is likely to be tested in coming days.

The market fell this week when USDA reports showed corn planting figures higher than expected (see here). However, concerns related to the European crop were largely believed to be overstated. The overall EU wheat crop is expected to be up 10% year on year, with the major production regions of France and Germany being up year on year.

Dry conditions in the black sea have left production analysts confused with forecasts from 71mmt to >80mmt. The one certainty about Russian crop forecasts is the high level of uncertainty, they always tend to surprise.

At the start of June many parts of Australia (including most of WA) were missing out on rainfall, and it was looking very dicey. However, fortunes have turned around for many with substantial rainfall throughout the southern part of the country.  The forecast for the next 8 days is looking positive which will provide some additional confidence going forward.

The big area of concern is a rectangular area of NNSW and SQLD, which seems to be missing out on every forecast (see Figure 2). This is the third year in a row where winter crop conditions in this region have been poor. This is also an area where a large proportion of the domestic consumption of feed is located. In all likelihood, the season conditions will see large volumes moving from SNSW and VIC to meet demand.

What does it mean/next week?:
This is always my favourite time of the year for grain markets. The volatility is always up as new reports push the market back and forth. The July WASDE report will be released next week, which will give further insight into the global supply and demand picture.

If the corn crop hadn’t had its planting issues the wheat market would be substantially lower than at present. We will likely be in for a wild ride over the coming weeks.