Category: Grain

Red Alert for the season?

The Bureau of Meteorology (BOM) has put the country on alert. Last week they updated the El Niño tracker to ‘alert’ status. Their view is that there is a 70% chance of an El Niño forming in Autumn. We thought this was an opportune time to look at both El Niño & La Niña, and what it means for the nation’s wheat production.

According to the BOM, ‘El Niño’s often lead to drier conditions over large parts of Australia, while La Niña’s tend to enhance rainfall over much of the continent’. However, it must be noted that not every drought is associated with El Niño nor every wet year with La Niña.

In this analysis we examine the El Niño and La Niña events which have been considered moderate to strong from 1960 to determine what impact these events have on grain production. The analysis will examine the year on year change in wheat production.

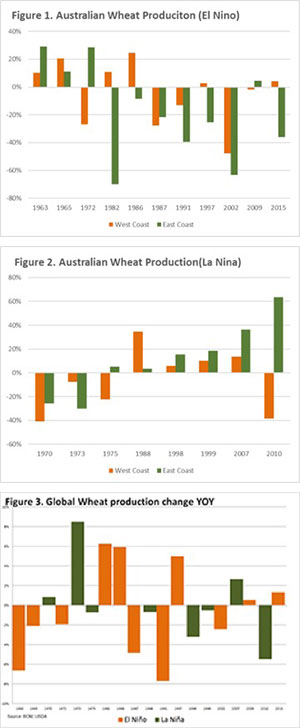
In figure 1, we see the year-on-year impact of El Niño split into east coast and west coast. In the period 1960-2015, 7 of 11 El Niño years have recorded a reduction in wheat production, with 6 of these years recording a > 20% reduction. In Western Australia the impact of El Niño has been less negative, with 6 out 11 event years recording an increase. However, only two of these years record > 20% increase. In addition, during the years of production decline, 3 of these years recorded large production falls of > 20%.

The year-on-year impact of La Niña is displayed on both the east and west coasts as highlighted in figure 2. In the period 1960-2015, there have been 8 La Niña events. The east coast during these La Niña events experienced 6 years where production has been higher, with 4 being >15% and 2 events where production reduced by >20%. The impact of La Niña in WA has caused 4 out of 8 years to have a production contraction, with 3 of those years having a >20% decline. The La Niña years with an increase in production in WA have resulted in smaller increases than the east coast with the exception of 1988.

In both figure 1 & 2, it is evident that since the mid 1980’s in Australia El Niño events have overall been negative for crop production and La Niña events have been positive, with the exception of 2010 in WA.

In figure 3, the year-on-year impact of La Niña & El Niño is detailed at a global level. During an El Niño year we can determine that production was reduced in 6 years out of 11, and increased in 5 years with no changes of more than 10% on a global level. During La Niña years, global production has increased in 3 out of 8 years, whilst production has decreased in 5 years.

Key points:

  • El Niño events tend to have a larger negative impact on east coast Australian production, with 6 out of 11 moderate to strong El Niño years recording >20% decrease.
  • La Niña events tend to result in increased production on the east coast, especially in events since the mid 1970’s which may be due to more efficient water use.
  • La Niña years in Western Australia tend to be more subdued with lower production gains, and a higher chance of reduced production.

What does this mean?
The reality is that El Niño is a factor which can influence Australian weather patterns, however it’s not necessarily an indicator of whether a drought will form.

A good example is the past season which has neither El Niño or La Niña and the country has experienced a horrific drought.

The BOM haven’t yet announced El Niño as being in effect, so it’s all speculation at the moment. There is still a long way to go between now and harvest, and with such a volatile climate anything can and will happen.

Grain Traders: Another one bites the dust.

In this week’s market commentary, we discuss some good news in the barley market. Unfortunately, it is not good news all round though with the voluntary administration of mid-tier grain trader Lempriere Grain.

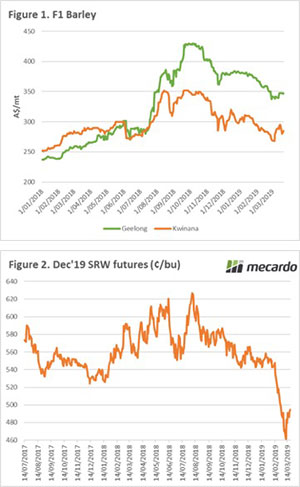
In recent weeks, we have been discussing concerns around the looming investigation by China into anti-competitive dumping of barley. If found against Australia, this will be negative for pricing which we have already seen with the deterioration of pricing (figure 1).

However overnight Saudi Arabia is tendering for a massive 720kmt of feed barley which will help with the demand side of the equation. These shipments are for the following periods

2nd half may – 180kmt red sea

1st half June – 240kmt red sea, 60kmt Gulf

2nd half June – 180kmt red sea, 60kmt Gulf

After falling for a number of weeks the wheat market has found its floor (at the moment) and has risen 2% since the start of the week, resulting in a A$2/mt increase in the December futures price (figure 2). The A$ has increased due to robust data and if the dollar was at the same level as Monday would have seen prices around A$1.6 higher.

In unfortunate news, the Victorian-based grain trader Lempriere Grain has entered voluntary administration. The business is owned by Starcom Resources (50%) and two companies owned by Will Lempriere. Their website has been removed, however, the archive is available on the link here.

There have been claims of slowing of payments in recent months. Then during the past week, the business stopped answering calls according to news reports. This was clearly of great concern to those who have outstanding debts with the business both to farmers and service suppliers.

It is likely that the losses will be substantial. Discussions with just a few trade participants would put the tally to at least $4m. The businesses impacted will now face a long and stressful slow to try and get their owed funds back.

I recommend that growers read the following two articles:

3 tips to minimise counterparty risk

Protect yourself from receivership with a PPSR

What does it mean/next week?:

The weather is the primary factor to keep an eye on in the coming week. There is substantial rainfall forecast across much of QLD and NSW, which will help provide some subsoil moisture to parched areas.

On the other side of the Pacific, the US is experiencing some big floods which although not yet impacting upon pricing, could delay spring planting.

Stock levels at the importer level

The current projections for the global crop are relatively positive. World production could be high, however there is still a long way to go. In this update we look at the stock levels held by the major importers of wheat.  

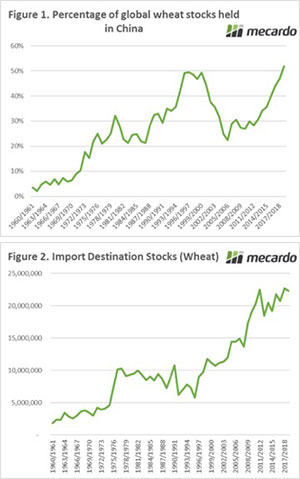
At present global wheat stocks are currently at the second highest level in history. However,  52% of the stocks are held within China (Figure 1). I have been discussing this as a growing issue for over a year (see here), so hardly a new piece of information to arrive in the market.

China as a nation is a large producer and have huge stockpiles in their inventory, yet it very rarely sees the light of day in the export market. The average exports from China since the turn of the decade have been 917kmt. The largest year of exports since 1960 was in 2007/08 with 2.8mmt. The high domestic price in China (Gov intervention) and historical precedence would point to China being unlikely to come to the aid of the global trade.

When Chinese stocks are excluded from the global situation, the world is sitting on similar levels of stocks to 2008/09 and 2012/13.

There was one big difference which isn’t regularly discussed. The stocks held by major importers of wheat. Agricultural markets work on a basis of supply and demand, however at times, we forget the demand side of the picture.

The major wheat importers in the world* seem to have learned some hard lessons from the past. The beginning stocks for this season are sitting at comfortable levels. The combined stocks at the end of this season will be the second highest on record at 22.3mmt.

Effectively import nations on a whole are better positioned for supply shocks, however a major distribution to supply would still result in price rises.

*Algeria, Bangladesh, Brazil, Egypt, Indonesia, Japan, South Korea, Mexico, Philippines & Turkey

What does it mean/next week?:

The world stocks (excl China) are at similar levels to 2008/09 & 2012/13, which were years when prices reacted strongly.

However, the import destinations are sitting on respectable stock levels.

Key Points

  • World stock levels excluding China are at similar levels to 2008/09 & 2012/13
  • The stocks held by major importers are at respectable levels.

Short sellers take profits.

After two months of almost continual declines, this week saw a strong rebound on profit-taking by short sellers. On Tuesday the Chicago market in A$/mt rose 5% or $11. The market was very short and the risks will now start to increase as the growing period progresses.

The volatile northern hemisphere market should now start to ramp up. The current outlook is reasonably favourable for the global crop, however, all that could change between now and August. Any bad news will be likely to see huge reactions, which will potentially provide pricing opportunities.

The Chinese government are yet to announce the result of their anti-dumping investigation, leaving us all on tenterhooks. In January barley exports to China were down 58%  compared to December, signifying de-risking by traders to avoid any potential un-costed tariffs/deposits.

However, pricing for feed barley has improved strongly in Western Australia (Kwinana) rising from $268 at the start of the month to $295 yesterday, back to levels in late January. Although according to sources in WA, there is little unsold by producers, it’s a good time to consider offloading old crop.

The BOM released their updated three-month rainfall projection yesterday. Although these projections can be highly dubious due to the nature of predicting weather events, they do point towards the majority of the country receiving median rainfall during the period April-June. Let’s hope they are wrong and we experience above average rainfall for this period and beyond!

Remember to subscribe to our new podcast:

Podcast

What does it mean/next week?:

Will the funds continue to close their short positions, or will we see a bearish tone descend back on the market?

Insulation from overseas sensation

The wider world has seen wheat markets fall since the start of the year. Forecasts for the coming global crop look positive, which if realized will result in prices remaining low. However in Australia we are currently insulated from factors overseas.

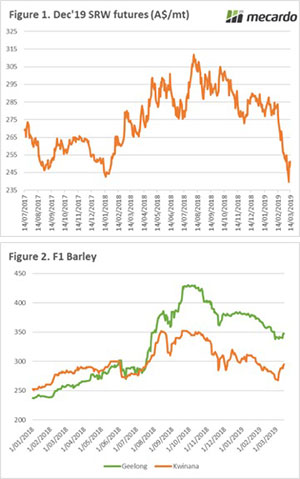
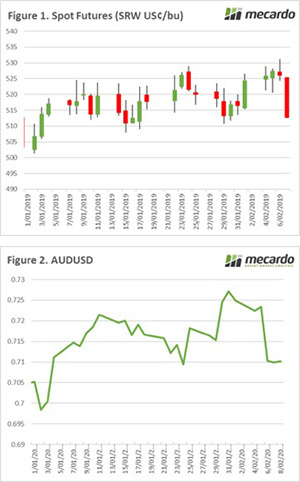
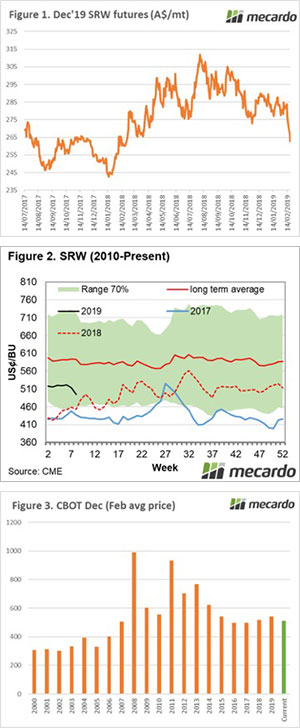
Since the start of February the wheat market has been at the mercy of gravity. On Wednesday the market gained some ground on a short rally, however it was short-lived with futures levels falling back to 11-month lows (figure 1).

The export pace from the US has been sluggish with their pricing uncompetitive versus other origins. At the current pace it is unlikely that the forecasts by the USDA will be met prior to the new marketing season – unless record shipments are made in the next three months.

At a local level, basis levels have fallen however remain at relatively strong levels. The ‘basis’ component of a price can be simplified down to the difference between the local price and the price of a futures contract. This basis can either be negative or positive. In recent years the range has been wide with the majority of the country close to A$20 over CBOT in early 2017. The past six months has seen basis rise dramatically which has insulated local pricing from the wider world.

Many factors impact the basis level such as grower selling, domestic supply & freight costs. The basis strength this year is due to domestic supply being reduced due to drought and consumers being required to pay higher values to ensure that grain is not exported. As we move into the new season, the conditions in the next six months will determine if basis returns back to normal levels.

It’s worthwhile reading my articvle from the end of February (Don’t get caught in the basis bubble)

What does it mean/next week?:

The WASDE report will be released overnight, it is unlikely that there will be much in the way of surprises.

The real drivers in our market will come from consumers deciding if they are concerned about the recent BOM projections and whether they want to remove their price risk for the coming harvest.

The bears are out for barley

It’s been a tough month for grain producers both locally and globally, with prices falling dramatically. In this weeks update, we take a look at the December futures contract, basis and potential issues with barley into China.

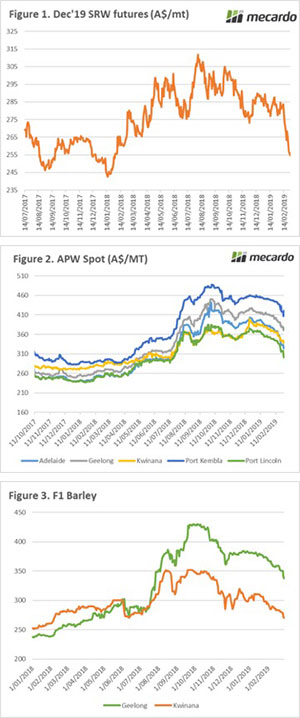
The futures market has another tough week, with spot futures falling 6% since last Friday to end the month down 13%. In A$ terms wheat futures have retreated A$30/mt. The December wheat contract which coincides with our harvest has fallen to A$254 (figure 1), the lowest since early February last year.

The highest price since the contract commenced was achieved in August at A$311, this would have provided a strong base for marketing the coming crop, with basis yet to be added to your overall price. The current market structure is starting to provide improved opportunities for consumers to hedge their requirements for the coming year.

At present basis is largely unchanged since the start of the month, which has meant that most port prices have followed the futures fall by A$30. The exception seems to be in South Australia, with basis falling A$24 in Adelaide and A$19 in Port Lincoln. This has resulted in price falls across the board (figure 2), obviously exacerbated in South Australia due to substantial difference in basis.

The barley market is in a precarious situation at present, with prices falling (figure 3) due to risk concerns related to China. It is likely that the conclusion of the anti-competitive dumping investigation will be released imminently.

Through conversations with a number of industry contacts, the general consensus is that it will be negative towards Australia.  The expectations are that a deposit of 55-60% of the value of any vessel importing barley ex Australia into China. The Chinese government will review the import and then return the deposit, provided there are no issues.

At present this is merely rumors and the result could feasibly go the other way, however at present the risk in selling barley into China is high, which limits the appetite of exporters.

As a side note, it was reported that China has bought eight cargoes of barley ex Ukraine in the past week. Is this a portent of things to come, with them buying barley ahead of an announcement?

What does it mean/next week?:

The wheat market has fallen substantially in the past month, will we see short speculator start to profit take? The commitment of traders report is only just starting to get back up to date and it will be interesting to see how far short the market is.

China is going to be the big story over the next few days, not just for Australia but also the long-awaited results of discussions re US trade tariffs.

Sausages, coal and interest rates

The grain market is not only steered by agricultural factors, many of the driving forces behind price movements are out with the industry. In this weeks grain comment we look at how sausages, coal and interest rates can have an impact on our industry.

In yesterday’s grain analysis “Don’t get caught in the basis bubble”, I discussed the issues around overseas values plummeting. Overnight there was a small correction, albeit remaining very close to contract lows.

In figure 1, the APW1/CBOT basis is displayed from 2016 to present. As we can see our premium over Chicago increased dramatically during the second half of last year as drought bit hard. These level smashed all prior records.

As we can see, the basis level has dropped dramatically in the post-harvest period. If we get an average harvest the basis level will converge back with new crop pricing; at a level closer to historical ranges. The basis has saved our pricing, but there is limited chance of these levels being around during harvest (unless we have a drought).

Nationals senator Barry O’Sullivan, caused uproar in China with comments related to biosecurity:

there’s a bigger chance of us having a biosecurity breach by some bloody old Chinaman who brings in his favourite sausage down the front of his undies

It’s clearly not a great idea to insult the countries most important trading partner. There are rumors that this comment and festering tensions could lead to barley being impacted with an anti-dumping tariff in the coming month.

It is reported that the port of Dalian has banned imports of Australian coal which could be a symptom of deteriorating trade relations. The A$ dollar was under some pressure as the market digested the information. At present Dalian only receives <2% of Australian coal exports, however coal exports remain Australia’s most valuable export, and contagion to other ports would have a dramatic negative impact on the economy.

In 2018 it was widely expected that rate rises would commence in 2019. There are now forecasts of not one but two interest rate cuts in 2019. These two cuts (predicted at 0.25%) will reduce interest rates to 1%. The current record low rate of 1.5% has been held since August 2016 (figure 2).

A reduction in interest rates will lead to a fall in the A$ which will benefit exports but will increase the cost of our import requirements. If the rates are passed on, it will provide cheap money for investment purposes.

What does it mean/next week?:

The world looks towards the northern hemisphere weather. At present conditions are good, and in places excellent.

However there is still ample time for disasters to occur.

Don’t get caught in the basis bubble.

Shocking production brings sensational prices. During the past six months grain producers have been dejected by production or elated by prices. As we move into seeding it is important to understand that Australian prices are held up by a bubble of basis. Will the bubble burst?

Australian wheat prices in all zones are at very attractive levels. It is important not to be too distracted by these prices as we move into the new growing season. Our prices in a typical year are dominated by the export market, this year domestic deficits ruled the state of play.

The most important factor to remember in marketing in grain is basis. This is not a complicated term, it is merely the difference (premium or discount) between two pricing points. In most discussions around wheat we refence basis between the physical and Chicago futures price. However, it could just as easily be the basis between our price and London feed wheat futures.

The reason I used the term bubble in this article, is that the basis levels currently experienced will only be maintained if we see major production issues in the coming season. If we receive an average to above average crop, our prices will again be weighted towards exports.

Therefore, it is extremely important to look at both local and overseas levels, especially as we move closer into the planting window.

The futures market has received a beating during the past week with spot futures back 8% since the start of the month. This equates to A$19, a considerable fall in anyone’s books (figure 1). At a seasonal point of view the market is largely following the expected trend albeit more sharply than normal (figure 2).

In figure 3, the average February price for the following December is displayed, along with the current price (green bar). At present the current average for February is highest since 2014, however with another week to go, we could see this slip further.

So why are global prices falling?

  • Demand from North Africa is declining
  • US wheat is uncompetitive versus other origins (Argentina & Russia)
  • Initial reports are positive for the coming crop in a number of origins

What does it mean/next week?:

It’s not all doom and gloom yet, there is still a long way to go between now and harvest. However, it is vitally important to understand the risk in the market.

Currently Australian producers can extract very strong prices as a virtue of our domestic deficit on the east coast.

These premiums over international values will not be sustained if we have a reasonable crop next season. Therefore, our prices will have to reduce to meet international demand, if we see global values fall, our levels will come in line.

At present producers on the east coast are able to access the ASX Jan 2020 contract at A$335, a basis level of A$72.

Key Points

  • Basis levels in Australia are at historically high levels.
  • Overseas values are under pressure.
  • The basis levels experienced in Australia at present will not persist unless there is a 2nd disastrous year.

EU wheat at a discount

In this week’s grain market update we take a look at the new crop contracts overseas now that we’re approaching the northern hemisphere harvest.

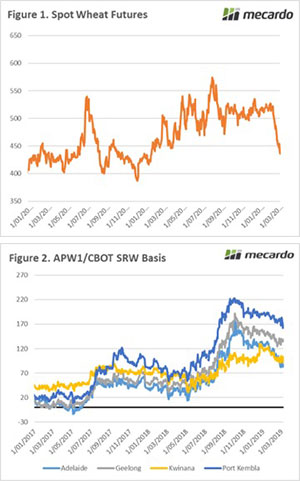
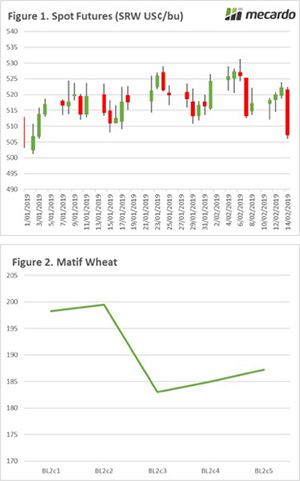
The Chicago wheat futures show some small gains at the start of the week, however overnight lost all of the weeks gains (and then some). The contract ended the week down 2%, or A$5 (Figure 1). This was due to US wheat exports for early January being lower than expected.

As we get close to the northern hemisphere harvest, the reliance on old crop starts to diminish as exports will start from the new pile.

This can be seen in the forward curve for Matif which is currently in backwardation (Figure 2). In a market experiencing backwardation, the forward future months will be priced at a discount to the spot futures market. A market in backwardation suggests that supplies are currently short, and buyers want the commodity now as opposed to the future. In essence this encourages sellers with stocks to sell now rather than hold, as the commodity is discounted in forward contract period.

It is still early but European and North American weather looks favourable to the crop, therefore the trade expects to see better production for the coming crop. This means there is less requirement (at present) to pay large premiums.

What does it mean?:

The BOM have released their 3 month climate outlook (Mar-May) with the majority of Australian growing regions forecast to receive median rainfall. Although long range forecasts need to be taken with a pinch of salt, it is positive compared to prior predications.

Down for the count?

The grain trade awaits the release of backlogged data from the USDA which will be broadcast this evening (8th February 2019)

The spot Chicago futures contract after posting gains in the post superbowl trading days, has been hit with an almighty hammer overnight. The future contract declined by A$6 overnight (Figure 1).

The fall in prices was due to a combination of factors (as tends to always be the case), the main ones being the expectation that XI-Trump trade talks are not as jovial as previously anticipated.

Another reason in the sharp overnight correction is due to the imminent release of backlogged data by the USDA.  The data released tonight will be the first information from the USDA since mid-December. Will this create fireworks or will it fizzle out?

The RBA have changed their tune on interest rates. In the past year the commentary was of a likely interest rate rise, however this week they are pointing towards potential interest rate falls. The impact of these statements was felt in the currency market with the AUD falling to 71¢ (Figure 2).

This is the second major crash in the AUD since the start of the year. After the last crash the market recovered shortly afterwards, the question will be – is the AUD down for the count or like Tyson Fury will it regain its legs?

A reduced local currency will help with exports. On the flipside however it will increase the cost of imported products such as fuel and fertilizer.

Due to an unexpected error, the Mecardo website has lost some functionality. We are currently working day and night to resolve the issue.

What does it mean/next week?:

The market will be chewing through the data releases from the USDA overnight, which will give the market its direction over the coming week.