Category: Sheep

Is this the bottom?

While the market again suffered a significant fall, the AWI commentary on the market noted that almost all of the damage occurred on day one of selling, with a more measured response from exporters on Thursday.

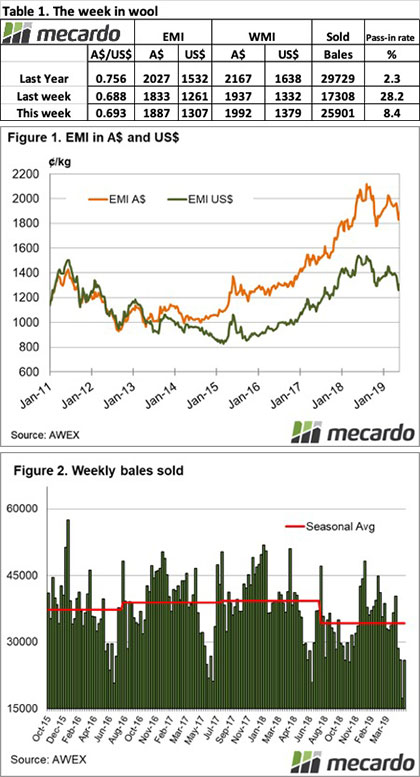
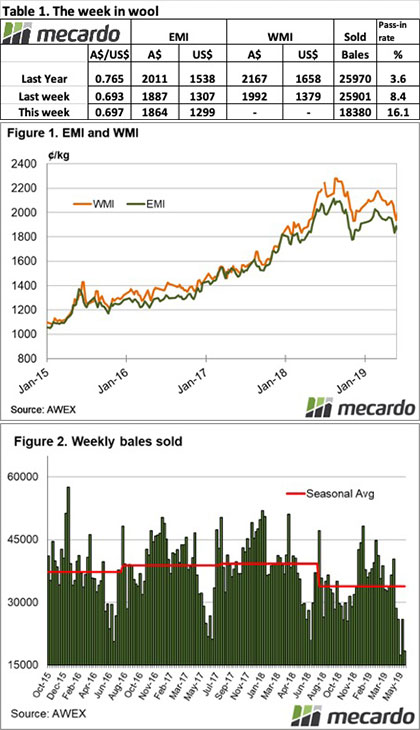
Since the peak of March, in four months the EMI has lost 261 cents, or 14%; while in US$ terms it has fallen 233 cents or 16%. Bales sold is also down, 84,500 or 15% less than over the corresponding period.

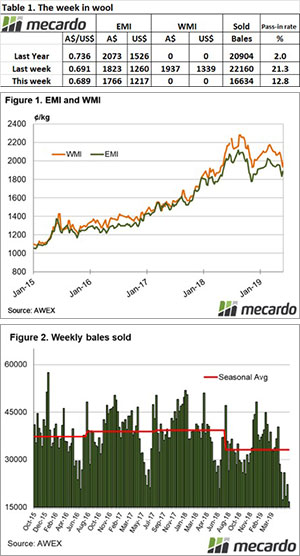
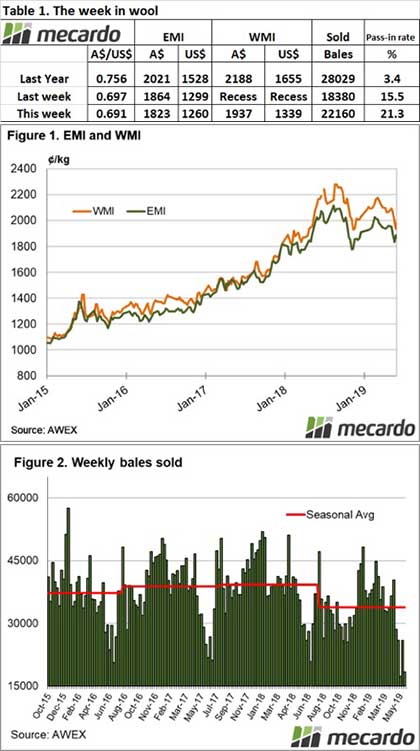
The Eastern Market Indicator (EMI) fell back a further 57 cents this week on top of the 41 cents fall of last week and closed at 1,766 cents. The Au$ was also weaker slipping below US $0.69 mark and as a result, the EMI in US$ terms fell 42 cents, ending the week at 1,218 US cents (Table 1).

The AWI market commentator lists exporter finance issues, trade & tarrif wars and Brexit as all factors impacting negatively on the market over the past four months.

On the positive side, the EMI has not been as low in US$ terms since October 2017, so for the processors who have stood back from the market the price now should be more attractive.

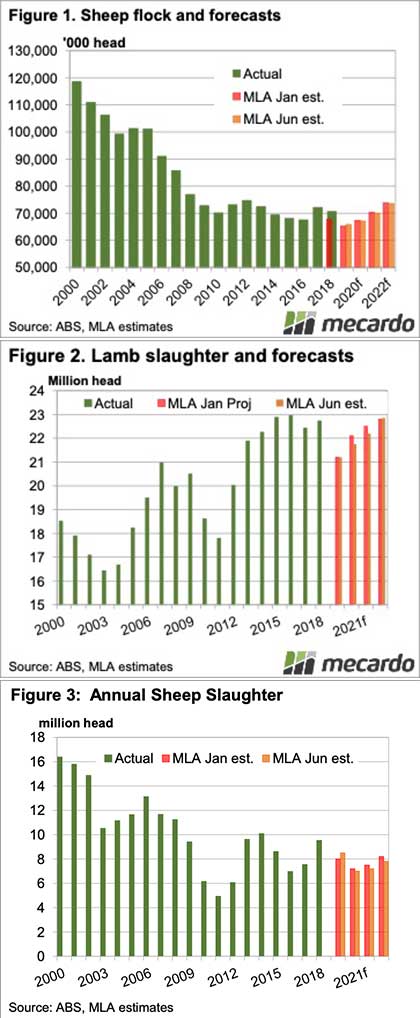
 Supply is well back, both in seasonal and year-on year comparisons causing exporters to run down inventories; so along with the fact that over the next 2 months Australia is the only market with any volume, if there is any move to replace stocks we will see stronger demand. These are all factors leading to the suggestion that we may see the market find support at these levels.

Only 19,072 bales were offered at Sydney & Melbourne, 9,068 fewer than last week with Fremantle again not participating. The pass in rate across the selling centres was 12.8% for the week, Although well down on last week’s 21.3% the low offering meant that 16,634 bales were cleared to the trade, 4,270 fewer than the corresponding week last year.

We looked back to 2015 and could not find a lower week of wool bale clearance, this could well be the lowest for 50 years or more!  In the auction weeks since the winter recess, 1,390,315 bales have been cleared to the trade, 278,830 fewer than the same period last year.

The dollar value for the week was $30.38 million, for a combined value so far this season of $3.150 billion.

The week ahead

Next week a combined offering of just over 30,800 bales is rostered across all selling centres. For the following weeks 35,200 and 35,500 bales are currently forecast.

It cannot be ignored that the wool market is weak. If we compare when the market was at 1750 cents in early 2018, the outlook is far less optimistic despite lower supply. Back then the thought was “the market can only go up”. 16 months later after running through 2,000 cents we are back where we started at 1766 cents, but with a far less optimistic outlook.

Winter tightening pushes prices northward… in the East

Declining sale yard throughput and slaughter levels for lamb and sheep markets are making their presence felt on price movements this week. Across the national market indicators prices were up for all categories of stock except for mutton.

East coast lamb markets leading the charge higher with reports of heavy lambs in Wagga fetching record prices of over $350 a head. The Eastern States Trade Lamb Indicator (ESTLI) reflecting the buoyancy across the eastern markets with a 42¢ gain to close yesterday at 885¢/kg cwt.

The National Trade Lamb Indicator (NTLI) climbing too, although not as robustly as the ESTLI, posting a gain of 22¢ to hit 874¢ – Figure 1. West Australian lamb markets dragging on the national lamb indicator figures with all reported lamb categories in the west posting falls between 40¢-110¢. The West Australian Trade Lamb Indicator (WATLI) off 65¢ to finish yesterday at 815¢.

East coast lamb yarding levels have taken a 34% dive in recent weeks to see it trending below the five-year seasonal pattern for the first time since April – Figure 2. Last season we saw a dip toward 120,000 head for east coast lamb yardings during late June, so we may not be out of the woods yet for the tight winter conditions.

Lamb slaughter levels in the east are reflecting the tight conditions too with the most recent figures dipping below the normal seasonal range to record the second lowest weekly figure since the start of 2019 at a whisker under 266,000 head – Figure 3. Bearing in mind that the lowest weekly figure this year was during the Easter/ANZAC shortened trading week for meat processors it’s a sign that margins are likely tight, at least for sheep and lamb processing lines.

What does it mean/next week?

The weekly rainfall forecast points to some decent falls scheduled for the west, up to 100mm for some south west coastal regions which could relieve the recent price pressure experienced in WA.

Across much of the rest of the sheep rearing regions across the nation there isn’t much rain on the horizon to support prices so producers will have to rely on the tight winter supply to keep some price buoyancy present.

Hopefully the live sheep export hiatus currently underway won’t continue to act as a drag on WA prices throughout the remainder of Winter.

Weekly Wool Forwards for week ending 21st June 2019

A quiet week in the forwards market with only two trades, reflecting the falling auction markets of recent weeks.

One trade was dealt in 19 micron wool for August and agreed at 2,050¢  One trade was dealt in 28 micron wool for August and agreed at 1,040¢.

It’s been a few weeks since we’ve seen the forwards market this reserved but it is to be expected in a falling auction market. Growers don’t generally lower their prices to suit a weak market, but hold for when it will eventually rise again. Until then, as prices fall in search for a base and the outlook looks less optimistic as explained earlier, we will likely see quieter forwards for some time.

No good news for the wool market

Another week of low offerings, high pass-in rates and price falls.The retracement from the February peak is well and truly happening.

All categories were impacted with the exception of the better prepared crossbred lots, although these were in scarce supply.

The Eastern Market Indicator (EMI) fell back a further 41 cents this week on top of the 23 cents of last week and closed at 1,823 cents. The Au$ held steady for the week at US $0.691 and as a result, the EMI in US$ terms fell 39 cents in line with the Au$ movement, ending the week at 1,260 US cents (Table 1).

AWEX report the EMI is now 293 cents below the record of 2,116 cents it achieved in August last year and 198 cents lower than the same time last year, a fall of 9.8%.

Fremantle had to catch up to the East coast following its one week recess. This realignment hit hard on Wednesday with a generally lesser continuing fall on Thursday. It was a very small offering of just under 6,000 bales in W.A., however growers passed in 2,400 bales or 40% of the offering. This could be a record pass in rate, even for Fremantle.

An offering of just 28,140 bales came forward nationally, 6,300 more than last week with Fremantle returning. The pass in rate across the selling centres again was high, at 21.3% for the week, up on last week’s 15.5%. This meant that 22,160 bales were cleared to the trade, 11,300 below the corresponding week last year. In the auction weeks since the winter recess, 1,351,521 bales have been cleared to the trade, 274,560 fewer than the same period last year.

The dollar value for the week was $42.20 million, for a combined value so far this season of $3.119 billion. A simple calculation of $ value divided by bales sold gives us $1,904 per bale across all types for the week.

Crossbred wools also fell on both days with the exception of some of the better prepared fine crossbreds which were slightly stronger. Oddments were cheaper, although some lots with low VM attracted stronger interest, again these lots were few and far between.

The week ahead

Next week a combined offering of just over 19,000 bales was rostered across all selling centres. For the coming weeks 31,000 and 34,000 bales are currently forecast.

The past 5 weeks has seen almost 40,000 fewer bales cleared to the trade compared to the same time last year. It is with interest we await the usual Spring flush of wool to get a feel for the full extent of the supply levels that will be available for the rest of the year.

Weekly Wool Forwards for week ending 14th June 2019

A very solid week in the forwards market with eleven trades dealt across the most popular MPGs.

Five trades were dealt for 19 micron wool, three for August agreeing at 2,035, 2,050¢ and 2,060¢. The remaining 19 micron trades were for September and agreed at 2,040¢ and 2,050¢.

Four trades were dealt for 21 micron wool. Two of those were for August, agreeing at 2,030¢ and two for October at 1975¢ and 1980¢.

One trade was dealt for 28 micron wool and agreed at 1,080¢ for August.

With auction prices plummeting, the forwards curve in the short term looks steeper than the last month or so. We expect it might change a few times before the market settles again.

Heavy slaughter to see new flock lows

  • MLA have only made minor changes to flock and lamb supply forecasts for the coming years.
  • The 2018 flock was 3 million head higher than the January estimate.
  • Sheep supplies are forecast for fall, but it may not be enough for a flock rebuid.

Meat and Livestock Australia (MLA) released their Industry Projections for sheep last week.  There were a few surprises, notably the steady lamb slaughter forecasts, along with relatively stable flock forecasts for the coming four years.  A higher than expected 2018 sheep flock has been dwindled down with sheep slaughter for the first four months of 2019 25% higher than last year.

While heavy sheep slaughter early this year could be expected to see even lower flock numbers than the January projections, a key alteration has seen things remain relatively steady.  MLA estimated the closing (June 30) 2018 flock in January was 67.73 million head.  The actual number, provided by the Australian Bureau of Statistics, (ABS) was 70.61 million head.

MLA are now forecasting a bigger fall in the flock this year, with the June 30 2019 number coming in at a new low of 65.26 million head (figure 1), down 7.6% on the final 2018 number.  The new forecast for 2019 is 1% higher than the January forecast, so the higher than expected flock at June 2018 has compensated for heavy slaughter thus far in 2019

The projections for lamb slaughter for the coming four years are little changed from January.  Figure 2 shows the 2019 forecast remains the same, while for 2020 and 2021 the forecasts have been cut by 1.5%.  Lamb slaughter is expected to be back near record levels in 2022.

The biggest revision came in the 2019 sheep slaughter forecast, which was increased 6% to 8.5 million head (Figure 3).  Sheep slaughter forecasts for 2020-2022 have been revised 3-5% lower, but this may not be enough.

Last week’s article looked at previous sheep slaughter levels, and where they needed to be for the flock to grow.  Sheep offtake needs to be lower than 10% for the flock to grow.  From a flock low this year of 65.26 million head, sheep slaughter will have to be 6.5 million head, and likely lower for the flock to grow.

What does it mean/next week?:

Even at the supply levels forecast by MLA last week sheep and lamb prices are going to remain very strong for the coming two or three years.  We think supplies could be even lower than MLA are forecasting, especially if the flock is grow by 8 million head over the next four years.

There is likely to be a drag on lamb supplies as well, with more females and merino’s likely to be held to join the flock, which will obviously add plenty of support at the sale yard level. 


Wool back on the roller coaster

After strong buying activity last week, this week we saw buyers retreat in what was the lowest offering since June last year with Fremantle not selling at all. The market fell back as buyers were cautious about filling orders due to the small offering and lower quality wool. In going over our records of bales sold (back to October 2015), this week and 2 weeks ago are the only times where sales on a weekly basis have been below 20,000 bales.

The Eastern Market Indicator (EMI) gave up 23 cents this week after gaining 54 cents last week and closed at 1,864 cents. The EMI has fallen 4 out of the last 5 weeks, with AWEX reporting it has lost a total of 96 cents since week 44. The Au$ again found some strength lifting almost 0.5 cents to US $0.697 and as a result, the EMI in US$ terms only fell by 7 cents to end the week at 1,299 US cents (Table 1).

An offering of just 21,787 bales came forward, almost 7,000 less than last week (note Fremantle did not sell). Growers again reacted against the easier market. The total pass in rate for the week was 15.5%, well up on last week’s 8.4%. This meant just 18,380 bales were cleared to the trade, 11,300 below the corresponding week last year. In the auction weeks since the winter recess, 1,351,521 bales have been cleared to the trade, 242,721 fewer than the same period last year.

The dollar value for the week was just $35.18 million, for a combined value so far this season of $3.077 billion. A simple calculation of $ value divided by bales sold gives us $1,914 per bale across all types for the week.

Crossbred wools also lost ground after a strong effort last week, losing 5- 10 cents, however the 30 MPG category was quoted slightly stronger. Oddments were cheaper, giving back the gains of last week. Since the Cardings peak of Sep 2018, AWEX report on average across the 3 selling centres Carding Indicators have fallen 571 cents.

The week ahead

Fremantle returns next week however a combined offering of just under 30,000 bales is rostered. The following weeks 19,000 and 31,000 bales are currently forecast.

Supply is always at its low point in Winter, however buyers and processors will be watching closely to see the extent of the supply increase and quality improvement in the Spring.

A very flat micron price curve

  • The micron price curve from 15 through to 23 micron is extraordinarily flat at present.
  • Change in supply has been the key driver of this move to a flat price curve.
  • Fibre diameter is constantly changing in response to change in seasonal conditions.
  • As fibre diameter changes, so too does the supply of different micron categories and consequently the micron price curve.

Last week the 19 MPG finished 5 cents above the 21 MPG, which is a very small premium.  In the bullish fine wool market of 1999-2001 many in the industry were carried away by the fine wool premiums, confusing a mix of cyclical factors as a permanent change in the prices structure of the greasy wool market. Given the poor performance of fine wool premiums since 2012 (with the exception of 2017) the risk is that the reverse of 1999-2001 could happen. This article takes a look at a key driver of micron premiums and discounts.

In Figure 1 the micron price curve for May 2017 and May 2019 is shown. The price curve is generated by setting the average 19.5 micron price to zero and comparing the other micron prices levels to it. In May 2017, fine merino premiums were high by historical standards, the opposite position to the current greasy wool market. Compared to 2017, the current market premiums for sub-19.5 micron have shrunk to negligible levels while the discounts for 20 to 22.5 micron have also shrunk to minimal levels. This has flattened the micron price curve.

In 1999-2001 a combination of favourable supply (less fine wool), a depressed apparel fibre market (man-made fibre and cotton prices were low for an extended period which dragged medium and broad merino wool to low price levels), a favourable fashion cycle which allowed fine merino wool to avoid low prices and finally a low exchange rate which helped boost the local price resulted in huge micron premiums for fine merino wool.

In the current market the reason for the flat micron price curve looks to be mainly a supply issue. Figure 2 compares the change in the two micron price curves shown in Figure 1 with the change in supply, by micron category, between May 2017 and May 2019. The graph tells the story. Where supply has risen, the micron curve has fallen and where the supply has fallen, the micron curve has risen. When looking into the future, keep in mind the fibre diameter of the merino clip is always moving in response to changing seasonal conditions so the pattern of volume change shown in Figure 2 will change and reverse at some stage. When the supply does change, expect price to react with the micron price curve changing accordingly.

Finally, in Figure 3 the actual micron price curves in cents per kg terms for May 2017 and May 2019 (from 15 to 24 micron) are shown. The price level for 15 to 17 micron has barely changed.  It is the broad merinos (20 to 23 micron) which have changed price levels dramatically, assisted by chronic under-supply since early 2018.

What does this mean?

Merino micron premiums and discounts are probably at their perigee. The fall in the average merino fibre diameter is shrinking, with a reasonable prospect of the fibre diameter starting to increase in the new season which would start to reverse the trends in supply seen during the past 18 months. From this the micron price curve will change once more, with micron premiums and discounts beginning to widen.

Weekly Wool Forwards for week ending 7th June 2019

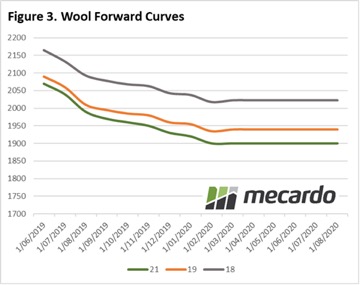
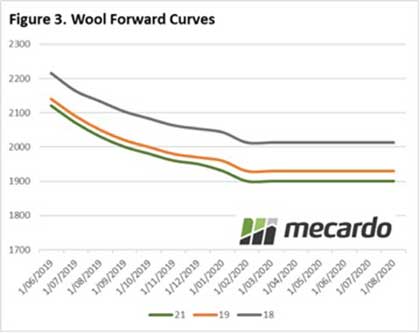
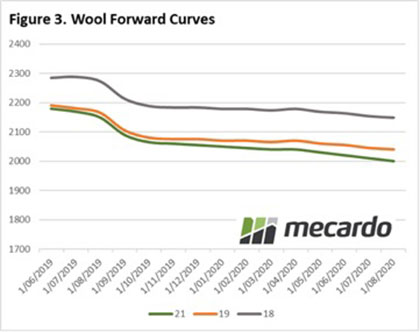
Another solid week in the forwards market, with 21 micron being the main MPG dealt.  One trade was dealt for 19 micron wool for August and agreed at 2,180¢. Four trades were dealt for 21 micron wool. One of those was for September at 2,080¢ and one for October at 2,050¢. Two trades were agreed for November at 2,050¢ and 2,075¢ respectively.  Two trades were dealt for 28 micron wool and were agreed at 1,100¢ and 1,130¢ for August.

We’ve seen the gap between fine and medium wools tighten in recent weeks, probably due to a higher supply of finer wools as a result of drought. Looking further down the track, if the rains keep falling, we’re likely to see the gap between fine and medium wools broaden again.

Wool buyers are back and busy

The wool market kicked back into gear this week as buying sentiment strengthened. A limited offering meant buyers were more aggressive with their purchasing to secure their requirement. All categories and microns felt the benefits. 

The Eastern Market Indicator (EMI) rose 54 cents on the week to close at 1,887 cents, nearly making up for last weeks 60 cent loss. There is still some way to go yet to climb back from the 3 consecutive weeks of a falling market.  The Au$ lifted this week to US $0.693 and as a result, the EMI in US$ terms rose by 46 cents to end the week at 1,307 US cents (Table 1).

The Western Market Indicator (WMI) gained 55 cents to 1,992 cents this week. Medium Merino wools attracted the most support. The largest increase being the 19 MPG in Melbourne lifting 80 cents.

Supply was again at low levels with the national offering of just 28,273 bales. With the market moving higher, growers were more content with their levels. The total pass in rate for the week was 8.4%, a dramatic drop from last weeks 28%. This meant 25,901 bales were cleared to the trade, which is in line with the volumes cleared this week of sale in 2018. In the auction weeks since the winter recess, 1,333,141 bales have been cleared to the trade, 252377 fewer than the same period last year.

The dollar value for the week was $50.69 million, much improved on last week. The combined value so far this season is $3.042 billion. A simple calculation of $ value divided by bales sold gives us $1,957 per bale across all types for the week.

Crossbred wools felt the results of strong demand, rising 45- 50 cents. Oddments also moved higher, with AWEX reporting that locks came under intense pressure as multiple exports competed for limited quantity which pushed prices up 30 – 40 cents.

The week ahead

Fremantle aren’t holding any sales next week, so the roster for Sydney and Melbourne is looking at a combined offering of just 23,619 bales. The following weeks 23,360 bales and 19,610 are currently forecast. While we usually see a dip in supply as we draw to the end of the selling season, this will add to what is already 12% less auction volumes this season to date compared to the same period in 2018/19.