Global cattle in A$ terms
Key Points
- Diverging price trends between the US and Australia during much of 2016 saw the usual EYCI discount spread to US Feeder Steers move into extreme positive spread territory.
- A lift in US cattle prices in the last quarter of 2016 saw the spread return to a discount.
- Current US Feeder Steer prices at 122US¢/lb translates to around 351A¢/kg lwt while the EYCI is trading at around 342A¢/kg lwt
 Often at Mecardo we look at local and global cattle price relationships in US$ terms as the US cattle market is one of the key drivers of Australian cattle prices over the longer term. However, in this analysis we flip the magnifying glass to take a look at global prices in our terms.
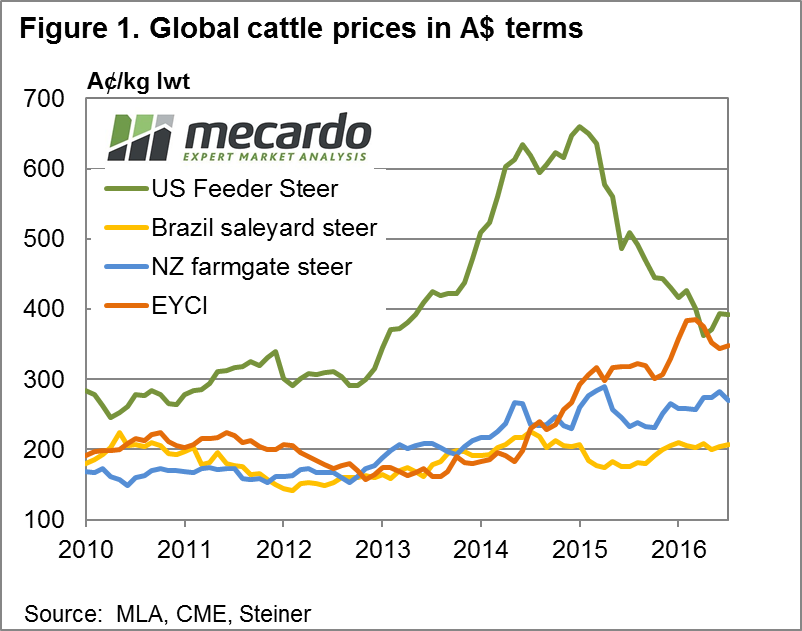
Figure 1 shows a handful of global cattle prices compared to the Eastern Young Cattle Indicator (EYCI) expressed in A$ terms on a live weight basis. Clearly, we can see for much of the period between 2010 to 2013 US Feeder Steers held a reasonable premium to comparable cattle prices in Brazil, NZ and Australia. However, during 2013 to 2015 the US market took off and the prices there doubled from 300¢ to over 600¢/kg lwt. During much of the 2013 to 2015 period prices in Australia remained subdued due the very high drought induced turnoff and Brazilian prices were kept under wraps due to a rapidly devaluing currency, while prices in NZ showed some modest gains.
Australian cattle prices started to rally into 2015 as seasonal conditions improved and for much of the 2015/16 seasons continued to probe higher as restocker demand buoyed the market and an optimistic outlook encouraged the beginning of a herd rebuild. In contrast, being further along the rebuild phase, US cattle prices began to ease during this time frame as production here increased.
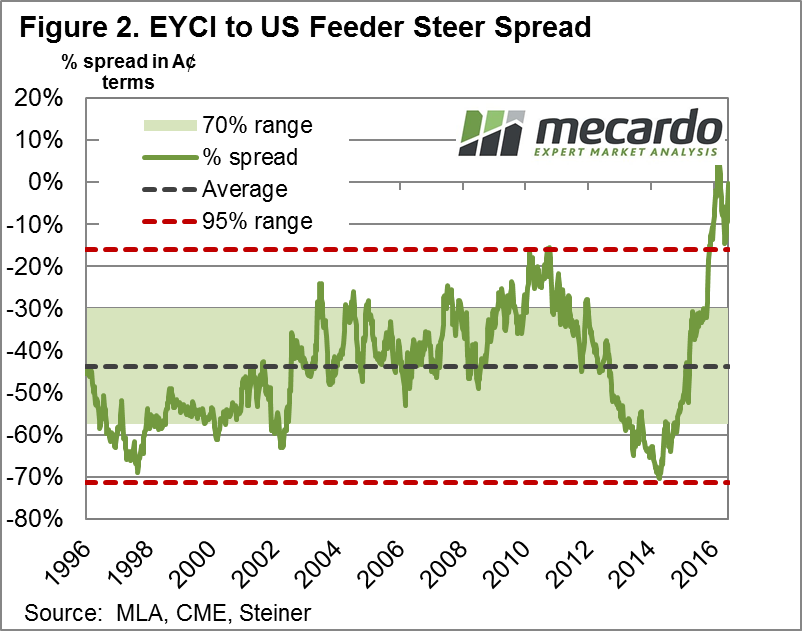
The divergence between US and Australian prices can be seen by the sharp narrowing of the percentage discount spread between the EYCI and US Feeder cattle as highlighted in figure 2. Indeed, the spread narrowed so much that it went to positive territory for much of the 2016 season. Overlaid on the chart for figure 2 is the green band showing where the spread has fluctuated for 70% of the time, the 95% range as indicated by the two red dotted lines and the long-term average spread, which sits at a 43% discount of the EYCI to US Feeder Steers, when comparing priced expressed in A$ terms.
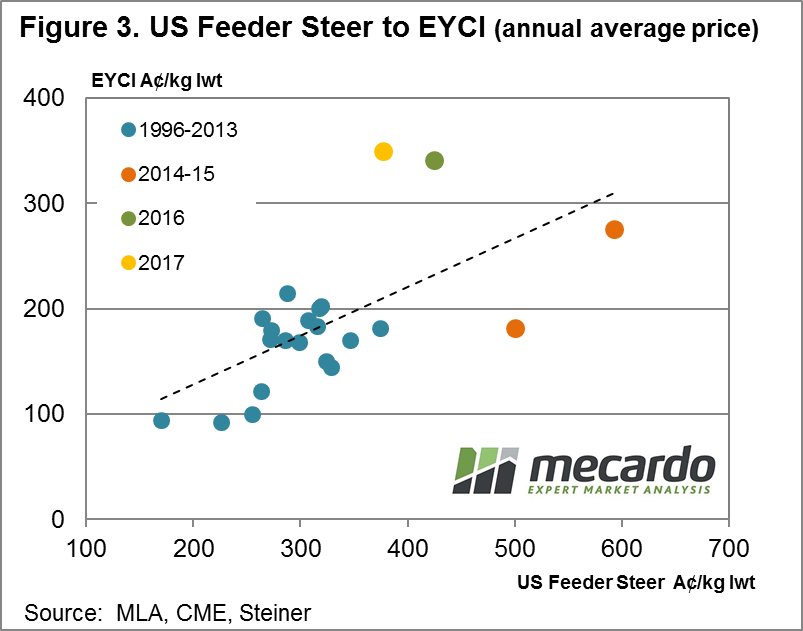
 Taking a look at the correlation between US Feeder Steers and the EYCI we can see a moderately strong relationship between the two series when looking at annual average prices expressed in A$ terms – figure 3. Although, as previous Mecardo analysis has shown, the correlations between Australian and US prices are stronger when comparing annual average prices in US¢/kg.
Click on the links above and below to read past analysis on correlations between US and local prices in US$ terms.
EYCI and 90CL beef export price
US Live cattle futures and National Heavy Steers
What does this mean?
 The lift in US prices since October has taken some of the downward pressure off local prices. Although from a longer term historical perspective local prices remain in overvalued territory and have not been helped by a stronger A$ during January.
A continuation of the downtrend in US prices or a significantly higher A$ (above 85US¢) would see some pressure return on local prices. However, on the flipside, tight local supply, a continuation of the herd rebuild and the remnants of a very favourable weather pattern during 2016 should be enough to see local cattle price remain buoyant for the first half of the year.

