A closer look at short merino fleece supplies
Last August Mecardo reviewed the supply of short wool in the clip and drew the conclusion that overall the proportion, while varying, did not have a definable trend. This time around we look at much shorter term data and drill down by micron category to see what changes are present in the current market.
 In the earlier analysis (Is there more short wool in the clip August 2016) the focus was on the overall proportion of short wool within the Australian merino clip. The current market has a raft of changes in supply going on, which vary markedly between micron categories. This is a function of different seasonal conditions between regions, with wool from the various regions having quite different characteristics. The article from last week (Where is all the broad merino wool coming from) was based on this principle.
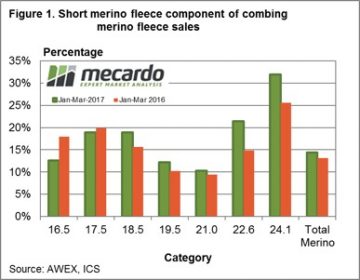
Figure 1 shows the proportion of short (50 to 69 mm staple length) merino fleece wool sold during the March quarter this year and in 2016. The volumes are broken up by micron category. These categories are set roughly to match the old Chinese wool types, with a total merino fleece proportion shown on the right hand side. Generally the proportion of short fleece wool early in the calendar years has been around 15-20% for 17.5-18.5 micron, 10% for 19.5-21 micron and higher for the broader merino categories. Overall around 13-14% of merino fleece sold is in the 50-69 mm staple length category.
 Figure 2 is where the data becomes interesting. This shows the year on year change in volume for 50-69 mm length merino fleece wool by the micron ranges, for the January to March period. The changes vary widely. There has been a lot broader short staple fleece wool sold in 2017. This fits with the analysis from last week of the broader merino micron volumes. It points to plenty of downward pressure developing in the market as it struggles to absorb increases in the range of 40% to 100% of broad short staple fleece wool. This explains some of the low quotes coming out of the market for wool in these categories.
Once again we are reminded that the analysis of wool supply needs to drill down to levels at which the supply chain operates. Mills do not source merino wool as such, but merino wool of certain characteristics. When the supply of wool of the characteristics changes relative prices in the market will adjust. The conclusion in August that there was no discernible trend in the supply of short staple merino wool, while correct, neglected to look at changes at a lower level. Figure 3 shows a similar analysis to Figure 1, except it is a snapshot from a decade earlier. The proportions of short staple wool are markedly different between the micron categories. They are a lot higher for fine wool and much lower for broad merino wool.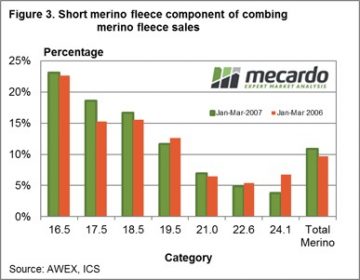
Key points:
- The proportion of short staple merino fleece in the clip varies between micron categories.
- The proportion is higher for broad merino categories.
- Broad merino short staple wool supplies are up by 40-100% in 2017 so far.
- A decade ago fine merino categories had the highest proportion of short staple fleece.
What does this mean?
The supply of short staple fleece has increased in broad merino wool during the past decade, and has picked up markedly compared to year ago levels. Price relativities will react to the increased supply by discounting the shorter staple wool, which may have implications for farmers planning shearing at shorter staple lengths.

