Category: Sheep

China increasing share of New Zealand’s lamb

Earlier in the week we took a look at beef export flows out of New Zealand, and the impact increased Chinese demand was having on markets.  Chinese demand for lamb and mutton has also been on the rise, and it’s an opportune time to look at how New Zealand is faring on this front.

New Zealand is Australia’s only real competitor in lamb export markets, and as such it’s worth checking in on how their exports are tracking.

China has traditionally been a large market for New Zealand.  For the year to date New Zealand has exported more than twice the amount of lamb to China than Australia has.  Over the last five years New Zealand has exported 64% more lamb to China than Australia.  Needless to say China is a major market for New Zealand.

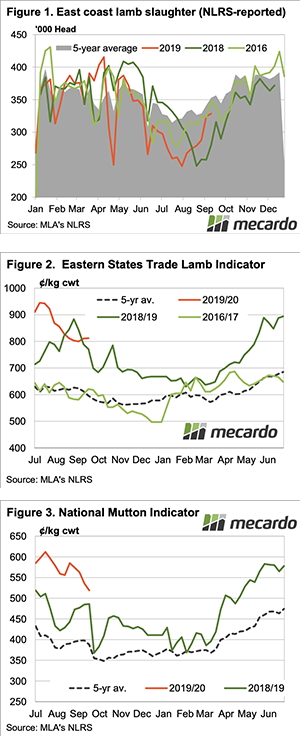
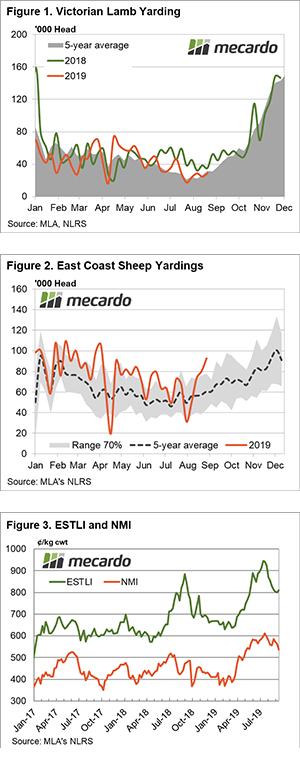
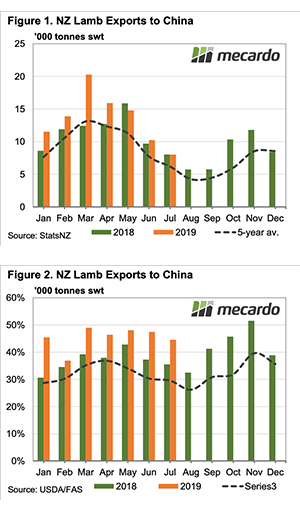
Despite being historically strong, New Zealand’s exports to China have been even stronger this year.  Figure 1 shows that every month except May have seen larger NZ lamb exports to China, and this has seen the year to July exports up 19% on last year, and 37.5% on the five year average.


The increases in exports to China have not been due to stronger production.  Figure 2 shows China’s share of New Zealand’s beef exports has grown this year.  For the year to date 45% of New Zealand’s lamb exports have gone to China.  China’s share was well up on 37% in 2018 and 32% average over five years.

Figure 1 shows there is plenty of seasonality in New Zealand’s exports to China, and while this is a function of production seasonality, China’s share of exports does decline in winter.  A smaller share for China when production dips is likely due to European markets having more money.

China’s increased volume and share or New Zealand’s lamb exports has come largely at the expense of the United Kingdom.  The UK is New Zealand’s second largest export market, yet its share lamb exports has fallen from 16% in the year to July 2018 to 12% in 2019.  The US is the third largest market to NZ lamb, and managed to maintain its share at 7%.

What does it mean/next week?:

Increasing demand for lamb from China has been impacting our friends over the ditch as well.  We can see declining production and exports from New Zealand in June and July obviously helped push our prices higher.

Moving forward China will start getting more lamb out of New Zealand in November and December, and this will help keep a lid on price rises here.  However, the increasing share of lamb going to China means other markets might have to come to Australia to find their fill.

Lamb up mutton down

The lamb market seems to have found a level it like, but mutton continued to slide this week.  It doesn’t seem price moves were in response to supply, with demand shifts driving markets early in the spring.

The data is a week old, but east coast lamb slaughter to the end of last week saw the rise in lamb slaughter slow.  Figure 1 shows lamb slaughter still running ahead of last year, but at similar level to 2016.  Back in 2016 the Eastern States Trade Lamb Indicator (ESTLI) sat at 621¢ in mid-September.  It was a great price for the time, but now the market is 190¢ stronger.

Figure 2 shows the ESTLI has now been steady for a month despite rising slaughter levels.  This gives an indication that processors might be able to move lamb at around 800¢, and are happy to increase slaughter levels at this price.  There is a way to go in rising supply before chains are full and prices come under significant pressure.

Rising lamb supplies are putting pressure on mutton values.  The National Mutton Indicator (NMI) fell another 35¢ this week to hit a six month low.  Mutton does remain 33¢ above the levels of this time last year, but that was under very strong supply.

Prices in the west have also found a base, but at a lower level.  The WATLI gained 13¢ this week to move back to 646¢/kg cwt and not far off over the hooks quotes.  WA Mutton was also up, at 451¢ now at a much smaller discount to the east coast.


What does it mean/next week?:

Unless you are on the North West coast of the country the latest Bureau of Meteorology (BOM) three month outlook, released yesterday, was not very promising.  There is a less than 35% chance of anywhere on the east coast getting median rainfall from October to December.

Normally this would mean increased supply and lower prices, but the dwindling flock will mean it can’t be as strong as last year.

Weekly Wool Forwards for week ending 20th September 2019

Futures contracts have been chugging along with eleven trades this week.

We saw one trade for 18 Micron wool, agreeing at 1,800¢ for March 2020.

For 19 Micron wool, five trades dealt. One trade was agreed at 1,755¢ for October and for November, one trade agreed at 1,720¢. Two trades were dealt for December, agreeing between 1,710¢ and 1,720¢.

For 21 Micron wool, four trades dealt, one for October at 1,620¢. One trade was dealt for January, May and June 2020 and these agreed at 1,630¢, 1,580¢ and 1,600¢ respectively.

One trade was dealt on 28 micron wool, agreeing at 900¢ for October.

Confidence continues to be evident in the forward market, even while the auction market volatility is still on the mind. Prices and interest could change in a heartbeat as the future really is uncertain.

Wool market rises from the ashes

It’s been a week of major come backs. While the wool market lift might not be the most celebrated national victory of the week, records were hit for six to make a spectacular recovery.

Goodwill discussions between China and the US on trade appear to have significantly boosted buyer confidence and resurged competition.

The Eastern Market Indicator (EMI) lifted 170 cents or 12% on the week, to finish at 1,535 cents. This correction was an all time record for the highest weekly increase of the EMI and has pushed the EMI back where it was a month ago. The Aus$ also lifted to US $0.687. This saw the EMI in US$ increase 125 cents to end the week at 1,056 cents.

Western Australia made the most staggering recovery. The Western Market Indicator rose by 242 cents to close at 1,625 cents (Figure 1). The daily gain of 198 cents was the largest increase in a day since records began according to AWEX.

All microns and types saw strong price rises but broader Merinos were most keenly saught after. 19.5 to 21 MPGS rose 175 to 305 cents across the three selling centres. Crossbreds saw further gains on last week in the order of 65 to 115 cents. The Merino Cardings Indicators also took a slice of the action, rising 90 to 185 cents on the week.

21,839 bales were offered to sale and just 6.2% passed in. This saw 20,488 bales cleared to the trade (Figure 2). There has been 94,403 fewer bales sold this season compared to the same period last year. This is a average weekly gap of 11,800 bales.

The dollar value for the week was $34.2 million, for a combined value so far this season of $330.69 million.

The week ahead

With China waiving some tariffs on US goods and the US postponing implementation of their tariff increase, both nations appear to be testing the waters ahead of face to face negotiations in October. These are positive signs for all in the wool supply chain.

This week has restored some confidence in sellers and as a result next weeks roster has increased to 31,107 bales. All three selling centres have sales on Wednesday and Thursday. The following weeks have also seen an increase in rostered offerings of 28,510 and 33,980.

Weekly Wool Forwards for week ending 13th Sept 2019

Interest in futures seems to be bouncing back, with 21 trades last week and 15 this week. Crossbreds have garnered some of that attention this week.

For 19 Micron wool, five trades dealt. One trade was agreed at 1,650¢ for November. Four trades were dealt for April 2020 and agreed between 1,600¢ to 1,670¢.

For 21 Micron wool, six trades dealt, one for September at 1,650¢ and three for November with agreements between 1,520¢ and 1,535¢. One trade was dealt for both January and April 2020 at 1,600¢ and 1,630¢ respectively.

Four trades dealt on 28 micron wool, two for both November and December agreeing between 835¢ and 850¢.

It’s good to see confidence returning in the forward market. That this has come when the auction market seems to have hit its base and indeed is bouncing back seems of little coincidence.

Unlucky mutton succumbs to Friday 13th

The Eastern States Trade Lamb Indicator (ESTLI) continues to hold above the 800¢ level as the Victorian flush shows no sign of getting underway yet. However, a jump in sheep yardings in recent weeks has seen the National Mutton Indicator (NMI) take a bit of a slide.

Victorian weekly lamb yarding numbers are running close to the five-year trend currently, just shy of 30,000 head, Figure 1. Last season a drier winter and spring saw numbers present earlier but this year the season has been relatively good for Victorian producers so there will be the opportunity to hold onto lambs to get the most out of their pasture.

The ESTLI seasonal spring decline has stalled in recent weeks as the east coast weekly lamb yarding numbers hover around the 150,000 head region. It is the surge in Victorian lambs we see during September to November that is usually the catalyst for the ESTLI to reach its seasonal low so the next leg lower in price isn’t likely to come until the Victorian throughput starts to swell.

Turning to markets with elevated throughput, East coast sheep yarding levels have been surging of late to see recent figures extend beyond the upper boundary of the normal seasonal range – Figure 2. Above average yarding levels in NSW a key driver of the high east coast figures with weekly sheep throughput over the last month averaging 36% above the five-year trend in this state.

NSW mutton prices reacting accordingly this week posting a 6.4% drop to close at 542¢/kg cwt and dragging the NMI lower too. The NMI finishing the week 4.8% softer at 536¢/kg cwt. In contrast, the ESTLI managed a slight gain, up 1% to rest at 811¢/kg cwt – Figure 3.

Next week

All eyes on Victorian lamb throughput levels in the next few weeks as that will be the clue to the timing of the next dip lower in the ESTLI. Our projections put the ESTLI trough this spring at around the 730¢/kg level in early November.

For the superstitious among us don’t do anything risky today – its Friday the 13th after all… and stay clear of black cats, just for good measure.


Top twenty Merino price falls since 1947

The August drop in greasy wool prices was substantial, with drought conditions increasing the sensitivity of farmers to lower wool prices at a time of high feed costs and high sheepmeat prices. This article takes a look at the average Merino micron price during the past seven decades and ranks the August price drop.

Greasy wool, like other commodities, is subject to big cyclical upturns in price and big cyclical downturns. The late rising cycle, which peaked in 2018, was boosted by falling supply. That factor remains, and looks likely to intensify, but seems to have been overridden by a combination of weaker retail demand and a supply chain upset by a tariff war between the USA and China.

Figure 1 shows a composite indicator which represents the average Merino micron price, from 1947 to last month in Australian cents per clean kg. The average Merino micron (as opposed to the average flock micron which is currently 1.1 microns broader) is also shown in Figure 1. The price is shown in nominal terms but even so the peaks of 1951, 1973 and 1988 stand out along with the 2018 peak.

Using this price series, the top 20 monthly price falls since 1947 have been calculated. These are shown in Table 1. The winner in terms of largest monthly price fall is February 1991 when the auctions recommenced after the failure of the Reserve Price Scheme (a salient reminder to anyone suggesting we should attempt to manipulate supply in order to manipulate price – if it was that easy). The collapse of the RPS and its immediate aftermath, have another three places of the top twenty monthly price falls.

The next major set of price falls come in a year best remembered for its peak – 1951. Five of the top twenty monthly price falls come from 1951 alone, after the market peaked in March 1951. That is a big effort.

The 1973 peak takes out four spots with two in 1973 and two more in 1974.

Following the 2002 price cycle, which was a classic post stockpile liquidation cycle, prices fell by 17% in May 2003. This ranks as tenth on the ladder.

Amongst these price falls August 2019 ranks ninth in proportional terms. In nominal terms, it is the largest fall but for a valid comparison to the earlier periods prices need to be adjusted for inflation.

The history of price falls after major cyclical price peaks suggests we could experience some more months (not necessarily staring away) of significant price falls. It is possible that the low and falling supply will help mitigate further big monthly falls. In 1988, supply was at peak levels while in 1951 supply was rising. In 1973, the greasy wool supply had fallen from recent levels but was still relatively high. The 2002 cycle was different as supply had fallen significantly in the previous decade.

Key points:

  • The August fall in Merino price ranks ninth in proportional monthly price falls during the past 70 years.
  • Following previous major price peaks, where supply was rising or was already high, there were a number of large month falls in the subsequent 1-2 years.
  • Supply is different in this cycle as it is low and falling, which may help reduce the number of big monthly price falls.

What does this mean?

The August price fall in the greasy wool market was not unusual when previous down cycles from major peaks are considered. Low supply remains an issue in the Australian greasy wool market, and it may show up by limiting the number of big monthly drops in price we experience.

Did the dead cat bounce?

The wool market had a small reprieve from the exhaustive losses that began in June. We did see a similar pause a fortnight ago, although reports from the auction floor suggest that this time around it might be the point of recovery as glimpses of fierce competition were observed on day two.

The Eastern Market Indicator (EMI) fell 32 cents on the first day of sale but recovered 22 cents on Thursday to end the week at 1,365 cents. The Au$ rose to US $0.682 at the weeks close.  As a result, the EMI in US$ terms actually saw a 9 cent gain for the week to finish at 931 US cents (Table 1).

In USD terms the Merino market has basically given up all its gains made since 2015, in the space of 7 months.

It was in Fremantle that AWEX reported a “noticeable change in the room” in the last hour of selling, with strong competition lifting prices. There was an overall loss across all fibres and the Western Market Indicator lost 33 cents on the week to close at 1,383 cents.

Most Merino types saw losses in the range of 10 to 30 cents. Crossbreds and Cardings managed to source some interest. 28 to 30 micron wool recorded gains of 5 to 10 cents, while the Cardings Indicators rose 10 to 30 cents in all three centres.

A significant proportion of sellers withdrew their offering prior to sale. A total of 21,694 bales were offered, of which 11.5% were passed in. Just 19,194 bales were sold for the week. Incredibly, in the seven weeks of this season, 81,731 bales fewer sold than the same period last year and 2018 was already a season of low supply to compare to.

The dollar value for the week was $29.32 million, for a combined value so far this season of $296.49 million.

Prices on the wool forwards market are currently sitting above the spot market, in a rarely seen case of contango. This provides further confidence that the physical market will pick up momentum in the coming weeks.

The week ahead

Was this week a case of a dead cat bounce or have we found the base is the question on everyone’s mind. Positive news in the planned resumption of US-China trade talks may have been the pinch of confidence that buyers needed.

Next week 27,923 bales are rostered on offer across Sydney, Melbourne and Fremantle. The following weeks 33,465 bales and 28,654 bales are expected.

Supply and demand find equilibrium

The main ovine indicators have found some sort of support in the last fortnight, with the Eastern States Trade Lamb Indicator (ESTLI) spending a second week just above 800¢.  Mutton has maintained its position in the 99th percentile.

Figure 1 shows the ESTLI remaining steady this week at 803¢/kg cwt. State trade lamb indicators were also relatively steady. Victoria remains cheap, at 750¢, while NSW is at the premium, at 815¢/kg cwt. The quality of trade lambs coming out of NSW is likely better, with bits and pieces of old season lambs are still depressing Victorian yards.

Lamb slaughter continues to creep higher (Figure 2). Mutton supply remains tight, but is still steady.  It appears more slaughter space is opening up to accommodate the slow increase in lamb supply.

Mutton prices have spent their fifteenth week above 575¢ in NSW, with similar prices across the east coast. Mutton slaughter was last week 42% below the same time last year, although it has been lower as recently as 2016. It’s hard to see mutton supply increasing, perhaps if the dry spring continues, we’ll see another wave of mutton.

WA prices have found a base, with WA Trade Lambs and Mutton relatively steady at 652 and 435¢/kg cwt respectively. Yardings in the West this week were less than half the same time last year, and it’s not surprising with WA over the hooks rates at 725¢ for lambs and 475¢ for mutton.

Next week

Often the trend with lamb prices is for a rapid fall from the peak, followed by a more gradual decline as we move through spring. The market is set up nicely for this sort of trend, with lamb supply likely to keep increasing as sucker supplies start to come from the south.

There are more showers forecast for areas already going ok this week, but the dry in NSW will continue to creep south. Store lamb prices are likely to be the first to head lower if it does remain

A floor has been found

The new key support level of 800¢ has held this week for the Eastern States Trade Lamb Indicator (ESTLI).  Prices steadied in all states, but it was the sucker lambs coming out of NSW which were priced the best.  

After dropping like a stone for five weeks the ESTLI found some support this week, right on the 800¢ mark.  The ESTLI had lost 150¢ over the previous five weeks, which equates to $30/head for a 20kg lamb.

There is plenty of speculation around as to the level at which processors can make money.  They might not be there yet, as lamb supply remains tight, but it is not far away.

In NSW lamb supply doesn’t seem so tight.  Figure 2 shows that at the end of last week (23/8) NSW lamb slaughter had returned to five year average levels, and sits 22.5% above the same time last year.

Prices are better in NSW, with trade lambs at 816¢ versus 748¢ in Victoria.  Much of this could be put down to a larger proportion of sucker lambs in NSW, and more old lambs in Victoria.  But it does seem demand for slaughter lambs is stronger in NSW.

National Mutton prices lost a little ground this week, down 11¢ to finish at 574¢/kg cwt.  Mutton is, however, the only ovine indicator which is stronger than last year’s levels, and a lot stronger, sitting 101¢ above the same week last year.

Low volumes in WA saleyards throw up some interesting moves.  This week restocker lambs in WA were down 128¢ to 481¢/kg cwt, while heavy lambs were up 122¢ to 687¢.  The heavy lamb price looks realistic, but restocker lambs look very cheap. There should be a bounce next week.

What does it mean/next week?:

The short and medium term rain forecasts are depressing.  South West WA is the only area which is expected to enjoy somewhere near normal conditions.  South East SA and South West Vic are forecast for a reasonable September, which should ensure some sort of spring (figure 3).  However October and November have a smaller chance of median rainfall.

For prices the basic take from this is store lambs will get cheaper in the east, in a relative sense, more expensive in the west, while slaughter lambs might be hard to produce after Christmas.