Category: Sheep

All red for sheep and lamb

Seeing all red on the Eastern States Daily Indicator Report for weekly sheep and lamb movements has been a rare occurrence recently.  This week finally saw enough stock come to market to send prices lower.

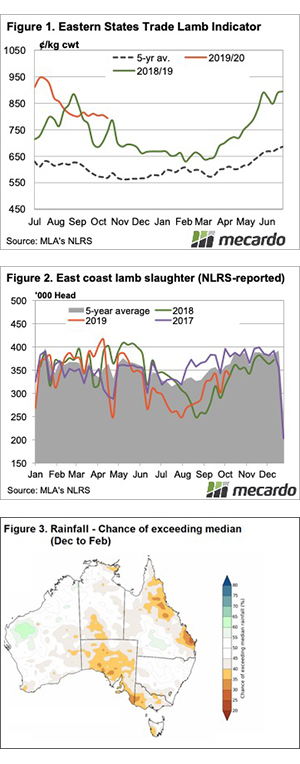
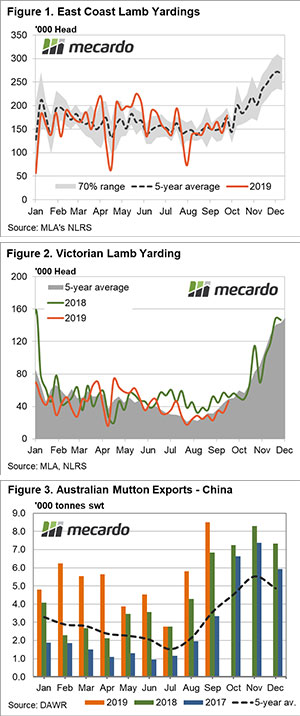
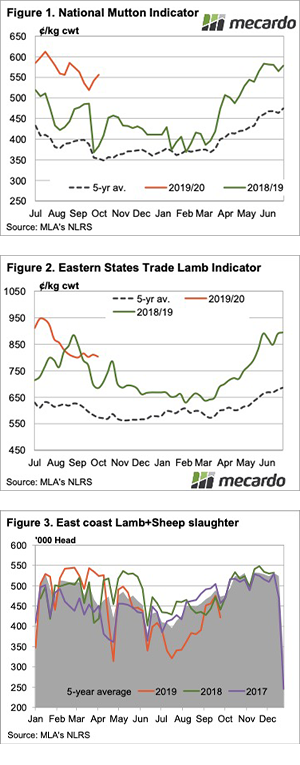
Week on week falls in sheep and lamb prices weren’t huge, but the Eastern States Trade Lamb Indicator (ESTLI) did hit a five-month low, breaking under 800¢ for the first time since May (Figure 1).  The ESTLI isn’t far off where it was after a brief spike in October last year, but it has found plenty of support around this level.

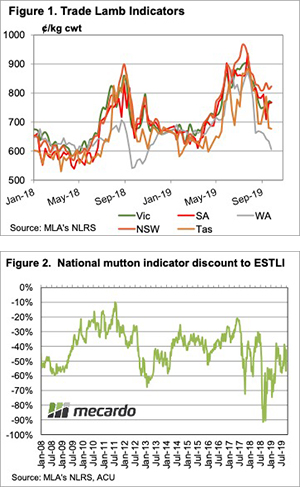
Merino lambs were the heaviest hit in terms of falls, the east coast indicator lost 44¢ to hit 716¢.  The Merino lambs seem to be coming in NSW, where they are 707¢, while in Victoria they are stronger, at 751¢.  This is the opposite spread of trade lambs, which tells us merino lambs are flowing in NSW, trade lambs are not.

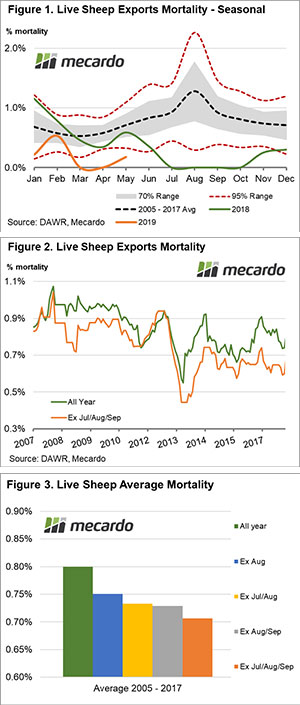
Lamb slaughter was lower last week, but that was due to a public holiday.  Slaughter is likely to be higher this week but looking at last year’s trends (Figure 2) it could gain another 10%, which would put some pressure on prices.

The weaker Aussie dollar is giving lamb prices some support.  In US terms the current ESTLI premium over last year’s low is 100¢, in our terms it’s at 125¢.  There is likely to be a downside, but we don’t think it will hit last year’s levels.

Next week.

The fortnightly Bureau of Meteorology (BOM) outlook is a bit more positive this time.  Figure 3 shows the December to February outlook, we left November out as it’s not great.  We might have to wait until the New Year to see the rain, which will bring the price upside.  In the short-term downside is more likely, but it won’t last long.

Early flush soaked up by offshore players

Lamb yarding numbers are starting to climb across the east coast fueled by lifting Victorian throughput as the spring flush gets underway. However, prices are yet to dampen as a resurgence in offshore demand, particularly from China has export buyers scrambling to fill orders.

Weekly east coast yarding levels reached the highest they have been since late July jumping 26% from the prior week and is closing in on 180,000 head (Figure 1). Driving the east coast volume of lamb is the lift in Victorian numbers signalling the early stages of the spring flush.

Victorian lamb throughput is 104% up on levels from a month ago and is nearing 50,000 head per week. Despite the additional volumes most categories of Victorian lamb prices increased this week indicating demand is more than compensating for the extra supply (Figure 2).

Indeed, lamb and sheep prices have lifted across all categories reported by NLRS for eastern states indicators, with restocker lambs, light lamb and mutton leading the charge higher. East coast Restocker Lambs posted a 19¢ gain on the week to close at 878¢/kg cwt, Light Lamb is up 20¢ to 800¢ and East coast Mutton is performing exceptionally well (particularly in percentage terms gains) with a 19¢ lift to close at 605¢.

September trade exports figures give us a clue as to why lamb and mutton prices are holding up so well in the face of the start of the spring flush. This is particularly true for flows going to China to fill the protein void created by the African Swine Fever (ASF) epidemic. Mutton flows from Australia to China have increased 208% from July to September and year to date Chinese demand is running 108% above the five-year seasonal trend (Figure 3).

Next week

The strong resurgence in offshore demand for Australian lamb and mutton product is timely given that throughout volumes are set to extend higher as we proceed through spring. The big unknown is how large the appetite from China will grow as we head toward the end of the season.

There is a good chance that an ASF led lift in Chinese demand for mutton and lamb, over and above the normal spring increases in Chinese trade volumes, will see prices underpinned throughout the next few months. This will limit the depth of the traditional spring flush price decline.

It’s a rollicking ride for wool

It concerns me that we are starting to get accustomed to the “roller-coaster” ride that has become the wool market. The wild fluctuations are causing sellers a headache, deciding whether to sell, pass lots in, withdraw or wait.

We can only guess what this is doing to the exporters and processors, as they manage supply requirements alongside the unpredictable price movements of recent months. It is hard to imagine anyone is pleased with the recent volatility and it must be damaging the wool markets reputation internationally.

The Eastern Market Indicator (EMI) rose 32 cents or 2.1% (after losing 97 cents or 6% last week), to close at 1543 cents. The Au$ also rose to US $0.675. This saw the EMI in US$ also improve 26 cents to end the week at 1041 cents.

The Fremantle sales also fared well, with the Western Market Indicator recovering 43 cents of the  92 cents loss of last week to close at 1,653 cents. Again a small offering selling just 6,245 bales with a PI rate of 13.1%, modest compared to last weeks 40.8%.

Sellers reacted in what has become their normal response by “selling” into the rising market. The National Pass-in (PI) rate was 7.6%, compared to 33.4% of last week. AWEX reported that in response to last weeks big falls, growers withdrew large volumes prior to sale. For the week 4,620  bales were withdrawn.

A decreased offering of 28,149 bales came forward, with 26,015 bales cleared to the trade (Figure 2). There have been 116,533 fewer bales sold this season compared to the same period last year. This is an average weekly gap of 9711 bales.

As reported this week by Andrew Woods on Mecardo (view here), fine Merino prices have been under pressure from increased supply during the past 12-18 months, which has resulted in premiums shrinking to very low levels. As the fibre diameter approaches year earlier levels and then starts to increase, the supply of fine wool will steady and then begin to fall. This will reduce downward pressure on fine wool premiums. The reverse process, to a certain extent, will apply to broad Merino wool.

The dollar value for the week was $45.83 million, for a combined value so far this season of $512.71 million, and a bale average value $1,730.

While last week the Cardings indicators held against the tide, this week they were cheaper across the board, averaging a fall of 20 cents. The news from the Crossbreds types was that the 26-28 MPG’s improved, except for poorly prepared clips which were cheaper or were passed-in.

Next week an offering of 40,056 bales are rostered.

To continue to predict the market movements in this climate is a bit like following the formline of “The Wallabies”, you don’t know what you will get until the day. The long decline in wool export volumes should begin to play on processor inventories (assuming sales are continuing), so we will go for the market to continue on an improving trend for next week.

Do we need a long moratorium?

The Department of Agriculture is taking submissions until October 28th that will help determine the future regulation of the live sheep export trade, including the proposed moratorium during the northern hemisphere summer. 

Analysis of seasonal live sheep mortality rates is presented in Figure 1. It shows the average monthly trend in mortality, the normal range (grey shaded zone) and an extreme boundary (upper and lower red dotted lines).

Traditionally the northern summer period (July to September) can see mortality peak. However, during the 2018 season the trade was suspended during this time resulting in no recorded mortalities from July to October. Interestingly, changes to shipping practices, such as reduced stocking densities, have seen much lower than average mortality rates outside the moratorium period for the later stages of 2018 and the first half of 2019.

Given that the usual peak in mortality occurs during the July to September period we assessed the impact on historic mortality rates for the 2005-2017 period if a moratorium had existed during these seasons.

Figure 2 highlights the rolling 12-month trend in mortality rates which shows the actual historic trend with the trade operating all year, unhindered (green line). Overlaid on the chart is the trend with July to September mortality rates excluded (orange line). Clearly, there is a reduction in mortality rates when the three-month moratorium exists. However, this moratorium comes at a cost to the viability of the industry, the supply chain and regional communities that rely on the trade.

To quantify the magnitude of the reduced mortality rates under the proposed moratorium, and to assess the potential impact of shorter moratorium periods we analysed the average long-term mortality figures based on a range of scenarios – Figure 3.

If you want to have your say on the impact of the moratorium make sure to submit a response to the Department of Agriculture discussion paper on the live sheep export trade here, before the 28th of October deadline.

What does it mean?

During the 2005 to 2017 period when the live sheep export trade operated without a moratorium the long-term average mortality rate was 0.80%, which equates to 400 sheep per shipment of 50,000 head.

Placing a moratorium only during August saw the long-term mortality rate decline to 0.75%, or 375 sheep out of a total of 50,000. A two-month moratorium, during July to August or August to September resulted in a 0.73% mortality rate, or 365 sheep. A three-month moratorium from July to September shows the mortality rate drop to 0.71%, which is the equivalent of 355 sheep out of a shipment of 50,000 head.

In terms of sheep survival, the difference between a one-month moratorium and a three-month moratorium is 20 sheep. The big question for our legislators is what is the cost of a three-month moratorium across the supply chain when you consider shearing teams of ten staff without work for a quarter of the year, small family business transport operators with 25% less work or feed suppliers with 30-40% less revenue?

Key points:

  • Changes to shipping practices during the 2018 season have seen live sheep export mortality rates reduce significantly, even accounting for the moratorium periods.
  • Long term average sheep mortality rates for the 2005-2017 period when no moratorium was in place were recorded at 0.80%, or 400 sheep out of a shipment of 50,000.
  • In terms of sheep survival, the difference between a one-month moratorium and a three-month moratorium is estimated at 20 sheep per 50,000 sent.

The market giveth, and the market taketh

The concerns we expressed last week about the weak finish to sales in Fremantle came to fruition, with the Melbourne and Sydney markets quickly adjusting down on the opening day.

This proved a catalyst for a loss of confidence and the market tracked lower wiping out last week’s gains and then some.

The Eastern Market Indicator (EMI) fell 97 cents or 6% (after lifting 67 cents or 4.2% last week), to close at 1,511 cents. The Au$ also eased fell slightly to US $0.672. This saw the EMI in US$ give up “only” 72 cents to end the week at 1,015 cents.

Western Australia had a tough selling week, selling just 4,300 out of 7,300 bales offered, (a PI rate of 40.8%) with the Western Market Indicator dropping by 92 cents to close at 1,610 cents.

Sellers reacted to the sharp sell-off with the National Pass-in (PI) rate increasing for the week to 33.4%, up by a massive 26% on last week. Again W.A. was a major influence, with almost 50% of fleece wool not selling, for a combined W.A. Pass-in rate of 40.8%.

An increased offering of 37,021 bales came forward, with 24,600 bales cleared to the trade (Figure 2). There have been 112,839 fewer bales sold this season compared to the same period last year. This is an average weekly gap of 10,258 bales.

The decline in Australian wool delivered to the world’s processors is alarming, looking at the same periods (July to current) for 2017, 2018 & this year we see 442k bales sold in 2017, followed by 383k last year & 270k this year to date. This is roughly a 40% decline over three years in bales sold to the trade. There is little doubt that demand for wool has suffered, with a myriad of possible reasons to explain this decline.

The dollar value for the week was $42.07 million, for a combined value so far this season of $466.88 million, and a bale average value $1,707.

Trying to find any shining lights this week is difficult, with the Cardings indicators up by an average of 4 cents, however, Crossbreds types were not spared and fell by 50 to 90 cents.

The week ahead

Next week a much-reduced offering of 34,174 bales are rostered.

AWEX notes that the volatile market has left “sellers uncertain”, I think it is fair to say the exporters are also feeling the concerns. The massive movements almost on a weekly basis are unprecedented; this will be making life difficult for exporters advising and negotiating buying orders.

Swine fever forces China sheepmeat demand lift

In the last month, African Swine Fever (ASF) has extended its reach to the Philippines, Korea and most disturbingly to Australian borders at Timor Leste. Additionally, official Chinese acknowledgment has surfaced regarding the scale of the impact on the Chinese pork industry. After the seasonal winter lull, sheepmeat exports from Australia to China have surged again as consumers scramble to fill a growing protein gap.

The first five months of 2019 saw significant growth in lamb consignments from Australia to China, peaking at 7,414 tonne swt in May. High prices for lamb and the winter lull in supply saw Chinese demand ease somewhat, although levels remained well above the normal seasonal range (Figure 1).

September saw a renewed surge in lamb export flows which took the monthly total to 6,141 tonnes swt. Year to date, the average monthly flow of lamb from Australia to China is trending 63% higher than the five-year average.

The jump in mutton flows from Australia to China were even more impressive over the September period, lifting 208% from the seasonal low posted for July (Figure 2). Year to date average monthly mutton exports are running 108% above the five-year average.

Combined, the flow of mutton and lamb to China this season is nearly at 100,000 tonne swt and represents 30% of our total export flows of sheepmeat this season (Figure 3). However, if we remain on current trajectories could see it reach to around 145,000 – 150,000 tonnes by the end of 2019.

What does it mean?

China has recently acknowledged that ASF has impacted their breeding herd with numbers down by around 35% this year. If their current infection and cull rate remains in place, they could see up to 200 million head of pigs taken out of their production system by the end of 2019. This would equate to a 40% loss in annual production, creating a protein deficit of up to 20 million tonne cwt.

Just for perspective, Australia’s annual production of beef is 2 million tonnes and our combined sheepmeat production is around 0.7 million tonnes, on a carcass weight basis. With no vaccine, ASF isn’t going to go away in a hurry from the Asian region. The disease will impact the global demand for protein for years to come.

For more information on ASF and the impact on the Australian agricultural environment contact us at ask@mecardo.com.au as we have detailed information available across multiple commodities and market sectors.

Mutton back in favour

October has started out pretty well for sheep and lamb markets, with lambs finding solid support and mutton back on the rise. October is traditionally a time of strengthening supply, so we might be seeing another lift in demand.

The National Mutton Indicator (NMI) rise last week wasn’t a dead cat bounce, unless it’s one that has lasted two weeks. The NMI gained a further 24¢ this week to move back to 556¢/kg cwt (Figure 1). NSW and Victoria are leading the way, at 588¢ and 598¢/kg cwt respectively, while WA is dragging the chain, at 467¢.

In lamb markets, the Eastern States Trade Lamb Indicator (ESTLI) has spent a seventh week sitting on support at 800¢ (Figure 2). This week the ESTLI closed at 803¢/kg cwt, with NSW at a premium and other states in the 740-760¢ range. Again, WA is the cheapest lamb state, at just 630¢, a significant discount to the east coast.

Traditionally sheep and lamb supply rise sharply at this time of year. After a couple of weeks interrupted with public holidays, figure 3 shows we should see at least a 10% increase in combined sheep and lamb slaughter. We’ve seen this on the five year average, and in each of the last two years.

Theory says for lamb and mutton prices to remain at current levels demand will have to strengthen, and with the commentary on the African Swine Fever ramping up, there is every chance exporters will be able to pay current prices for more stock.

Next Week.

Still no rain on the forecast, so we can expect supplies to at least follow seasonal trends, and maybe increase faster than normal. This could see prices start heading towards seasonal lows, but there is plenty of kill space to fill, and demand seems to be strong at current prices.

Weekly Wool Forwards for week ending 4th October 2019

Back to hushed tones and whispers in the forwards market this week, as only two trades agreed.

One trade was dealt for 21 Micron wool and agreed at 1,680¢ for later this month. One trade was dealt for 28 Micron wool and agreed at 920¢ for November.

With the auction spot-price yoyo bouncing so frequently and significantly, it’s difficult to know at what level things will settle, though, looking over the longer term, at least some sideways movement is evident. With a slim auction market, a good picture of average agreed trading price in any MPG becomes difficult. In addition to that, the more producers open themselves to risk by not posting their price, the broader the average gap between post and settle, due to the uncertainty that comes with slim pickings.

Plenty of price variance across the country

Lamb prices continued to track along sideway in east coast markets, but there were some wild swings in the remote states.  The Eastern States Trade Lamb Indicator (ESTLI) slipped below 800¢ for the first time since May, but things are worse in Tasmania and WA.

NSW has held a strong premium in saleyard trade lamb prices for the last month, and little changed this week.  NSW trade lambs are carrying the ESTLI, sitting at 823¢/kg cwt, while the ESTLI is at 796¢.  In Victoria and SA trade lambs are dragging the ESTLI down, sitting at 767 and 768¢/kg cwt respectively.

It is likely the difference between NSW and southern states is quality related.  There are plenty of sucker lambs in NSW yards, while the smaller numbers in Victoria as being depressed by small pens of old season lambs.

Figure 1 shows that trade lambs in Tasmania tanked, losing 182¢/kg cwt over the course of two weeks.  Yardings are small in Tasmania at the best of times, and this time of year they are even smaller.  With Meat and Livestock Australia lacking quotes for over the hooks lambs in Tasmania it’s hard to get a handle on prices, but the very large discount to Victoria can’t last long.

Tasmania might have cheap lambs, but they had the second most expensive mutton this week.  The Tasmanian mutton indicator sits at 557¢, a small discount to NSW which was at 578¢.

WA lamb prices continued to decline this week, heading towards 600¢.  With strong export demand, we would expect lamb prices to be better in the west, and they are now at an abnormally large discount to SA.

Next week

The bounce in mutton prices this week took its discount back to the top of the 12 month range (figure 1).  This might add a little pressure to mutton values, especially with forecasts for a hot dry spring to come.

Lamb slaughter continues to climb, but demand seems to be keeping up, holding prices steady.  The southern supply flush is still to come, which should bring with it a seasonal price low. It might not be too much lower however.

Calm after the storm

Last Thursday while Melbourne & Fremantle continued to lift, Sydney didn’t sell, so this week the market between centres firstly had to realign. This saw Melbourne down and Sydney up on Wednesday, however when the dust had settled at the close of the week there was a feeling of relief that the market overall was positive following a couple of tumultuous weeks.

Despite much speculation before the market opened that this week would see much of last weeks gains returned, the result was strong with a steady demand from buyers at the current market levels.

The Eastern Market Indicator (EMI) lifted 7 cents or 12% for the week, to finish at 1,542 cents. The Aus$ fell slightly to US $0.679. This saw the EMI in US$ fall by 9 cents to end the week at 1,047 cents.

Western Australia again had a positive result. The Western Market Indicator rose by 18 cents to close at 1,643 cents .

Again, it was the finer types that performed strongest, reflected across the three selling centres. Crossbreds were generally unchanged, however the Merino Cardings Indicators in Sydney and Fremantle lifted, with the 1,000-cent mark again in sight.

30,135 bales were offered to sale with 10.4% passed in. This saw 27,007 bales cleared to the trade (Figure 2). There have been 102,227 fewer bales sold this season compared to the same period last year. This is an average weekly gap of 11,359 bales.

The dollar value for the week was $47.09 million, for a combined value so far this season of $377.78 million.

The week ahead

Next week just under 30,000 bales are rostered, with the roster only increasing marginally in subsequent weeks.

Although the volatile market is still playing on all participants minds, there is somewhat a feeling of restored confidence. With the much reduced supply compared to previous years, the market should at least hold these levels, although the recent big swings will no doubt cause the market to remain on edge.