Lamb Economics 101
In last week’s piece on deflated lamb prices, we mentioned that the underlying reason behind the increased lamb prices we have seen since 2000 has been increasing demand. This analysis highlights the lamb demand curve and shows why prices have risen despite increasing levels of lamb slaughter and production.
Recap on the deflated lamb price article here.
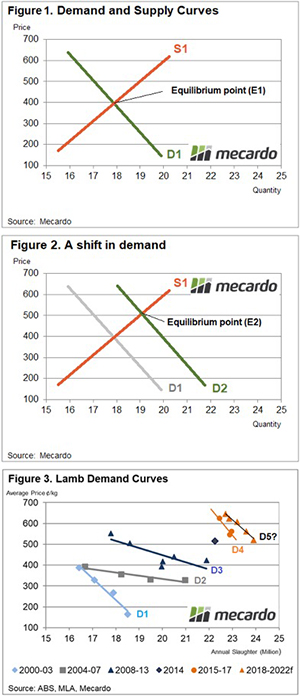
Before we cover how the demand for lamb has shifted over time it is probably prudent to provide a summary of the basics of demand and supply curves. Economic theory states that demand curves have an inverse relationship to price, or as prices rise the quantity demanded falls and as prices fall the quantity demanded rises. This is outlined by demand curve D1 in Figure 1.
In contrast, supply curves have a direct relationship to price. As prices go up so does the quantity supplied and as price goes down the quantity supplied is reduced, as highlighted by the supply curve S1. In a market, the competition between buyers and sellers act to push the price to an equilibrium level where the quantity demanded is equal to the quantity supplied. This is where the demand and supply curves intersect at a price level of 400 and a quantity of 18 units – point E1 on Figure 1.
Let us assume that in this market something happens, other than a change in price, that increases the demand for this product. This could be a successful advertising campaign for the product, an increase in income levels for the people that buy this product or perhaps a competing product become more expensive, leading to buyers shifting their preferences to this product. This would mean that for every price level, there is now more quantity demanded and this is represented by a shift to the right of the demand curve to a new spot, D2 on Figure 2. The new equilibrium point in the market is now established at point E2, at a higher price of 500 and a higher quantity of 19 units.
Effectively this has what has been happening in the lamb markets since around 2000 onwards. We have been seeing successive shifts to the right in the demand curve as the demand for lamb increases. We can see the plot of the demand curves for lamb as highlighted in Figure 3. Annual average price levels based on the Eastern States Trade Lamb Indicator (ESTLI) have been plotted against annual average lamb slaughter levels to estimate the situation of the demand curve at different points in time.
There are some more Economics 101 lessons in the Mecardo Wool analysis this week that focuses on supply curve shifts that have led to higher wool prices.
What does it mean/next week?:
The current surge in lamb prices suggests that the demand curve for lamb may have shifted further to the right again, fueled by a growing Asian middle class, a series of successful Meat and Livestock Australia marketing campaigns and a reduction in supply from our only export competitor, New Zealand.
The step ups in lamb prices, outlined in last week’s article on deflated prices tend to coincide with the shifts in demand outlined in Figure 3. Furthermore, the current demand curve shows that if there are no more shifts in demand in the coming years its likely lamb prices may soften back towards the mid 500¢ level for the ESTLI by 2022 as production and slaughter begin to increase. However, if the dry persists and the flock rebuild is delayed, the ability to increase production will be constrained, leading to sustained prices at current levels.
Additionally, if demand can stage another shift to the right beyond the next few years (as Asian buyers continue to become wealthier) there isn’t any reason why we can’t see an ESTLI of 900-1000¢ as we head towards 2025.
Key points:
- Since 2000 the lamb demand curve has continued to shift to the right, signifying that factors other than price movements have been responsible for an increase in demand for lamb.
- The shifts in the demand curve have coincided with intervals in time when the ESTLI has seen a step-up in the trading range.
- Growth in Asian wealth, successful marketing campaigns by MLA for Aussie lamb and a reduction in NZ supply are all reasons why demand for Australian lamb has increased since 2000.

